
For this post, the Gravwell analytics team ingested all 22 million+ comments submitted to the FCC over the net neutrality issue. Using Gravwell we were able to rapidly conduct a variety of analysis against the data to pull out some pretty interesting findings. We scraped the entirety of the FCC comments over the course of a night and ingested them into Gravwell afterward. It took about an hour of poking around to get a handle on what the data was and the following research was conducted over about a 12 hour period. So we went from zero knowledge to interesting insights in half a day. We’re kinda nerding out about it.
- A very small minority of comments are unique -- only 17.4% of the 22,152,276 total. The highest occurrence of a single comment was over 1 million.
- Most comments were submitted in bulk and many come in batches with obviously incorrect information -- over 1,000,000 comments in July claimed to have a pornhub.com email address
- Bot herders can be observed launching the bots -- there are submissions from people living in the state of "{STATE}" that happen minutes before a large number of comment submissions
When looking at the raw total number of comments, the majority fall into the anti-neutrality camp. However, after refining comments to include only those submitted organically via the FCC website (as opposed to those which were submitted via the FCC provided API for bulk submissions or by bots) the extreme opposite is true. People who submitted comments directly to the FCC website are overwhelmingly in support of net neutrality regulations. In fact, it was difficult to do any machine learning training or automated classification of anti-net neutrality comments, simply because they were that scarce. So, seeing a clear difference of opinion between bulk submitted comments vs those that came in via the FCC comment page we're forced to conclude that either the nature of submission method has some direct correlation with political opinion, or someone is telling lies on the internet.
We built a dashboard to show the total count for a period, a count of the organic entries, and then two panels which show our analysis of a comment being in favor of Title II classification for ISPs (net neutrality). For fast results, we did some basic classification based on regular expressions, the full query can be found below. This classification is certainly not without fault, but with Gravwell we can always look at the underlying data and our method proved to do fairly well. Pay close attention to the scale of the Pro and Anti net neutrality charts.
May

May activity seems dictated around the John Oliver Net Neutrality segment. May peaks at 1000 in favor and 3 opposed.
June

June peaks at 14,000 in favor, 130 opposed.
July

July has a large spike centered around the "take back the internet day". It peaks at 14k in favor, 10 opposed.
August

August sports a bump around the closing date for the comment period. It peaks at 91k in favor, 40 opposed.
We think there's still opportunity to pull out interesting tidbits. We found some things worth exploring regarding last names and nationality as well as population breakdowns by commenter address vs total state populations. We may build out a followup post with more FCC big data analytics.
One thing is certain about what we have found so far, though. The opinions of commenters using the organic website form submission and those whose comments were submitted in bulk or by bots differ wildly. This forces us to conclude that either the very act of going to the FCC comment site and providing a comment is only attractive to those of a certain political leaning, or that the bulk submission information is full of lies.
If you're interested in these kind of analytics for your own comments or other DevOps, drop us a line and we're happy to talk about how Gravwell can help you turn the data firehose into a well of knowledge.

Continue reading if you want to nerd out with us on the technical details of this analysis.
Background
There has been some published content on the FCC comments and the controversy surrounding them. Fortunately, the data is public and anyone can take a look. However, one of the problems with actually doing any useful analysis is that it can be quite time consuming, especially if you want to ask a lot of questions that require specific structuring of your dataset, or if you’re not entirely sure what questions you’ll be asking. Fortunately, we can use Gravwell to efficiently identify patterns, from lots of different perspectives.
With more than 22 million public comments regarding FCC Chairman Ajit Pai’s plan to roll back Net Neutrality (Title II), allegations of mass tampering and bot submitted comments are numerous. Many are calling out Pai’s reluctance to review comments for fraudulence and his refusal to condemn astroturfing. Many of the voices alleging fraudulent commenting point to these fake comments supporting Title II, and one proponent led non-scientific approach to validating data (News articles hit in May).
Research by others has shown support to the theory that this is most likely not the case and that anti-net neutrality comments may be more likely to be fraudulent (here; here; and here). ISPs also got in on the action, studying the responses themselves (here; and here); the findings from the ISP study further support the theory that by and large, Americans are vested in keeping net neutrality in place. Given both sides believe there was fraudulent activity, despite not agreeing where the issue lie, we were interested to see what Gravwell could glean from this data. The official period for public comment opened April 27, 2017 and closed August 30, 2017. The original close deadline was extended from August 16 to August 30, but did not meet the 8 week extension requested by proponents of net neutrality (details here). During the time period, both bulk and individual comments were being accepted. Bulk comments were uploaded using an API that required only an unverified email address to acquire.The FCC’s Electronic Comment Filing System (ECFS) holds all official FCC records for all docketed proceedings (https://www.fcc.gov/ecfs/). Gravwell pulled all Docket 17-108 comments from the FCC, resulting in a total of 22,152,242 comments.
We ingested the comments into Gravwell and began the process of data exploration. Analysis of potential fraudulent entries has been performed using metrics like email addresses stolen from data breaches. We wanted to see if we could similarly make a distinction between organic submissions and those from bots using other metrics that are more accessible. Fortunately, Gravwell allows us to do this efficiently -- we can explore the data in ways that allows researchers to both understand what Big Data is telling us as well as provide social monitoring that is platform agnostic.
Comment Frequency
The first thing of note when looking at only the frequency of comments is to see the distinct spikes in the timeline. Focusing solely on comments made during May, a bump around the John Oliver segment is expected. This mirrors typical increases in response rates when a “reminder” or “call to action” is given. What’s unexpected are extremely large and isolated spikes. (Click the screenshots for full res versions)
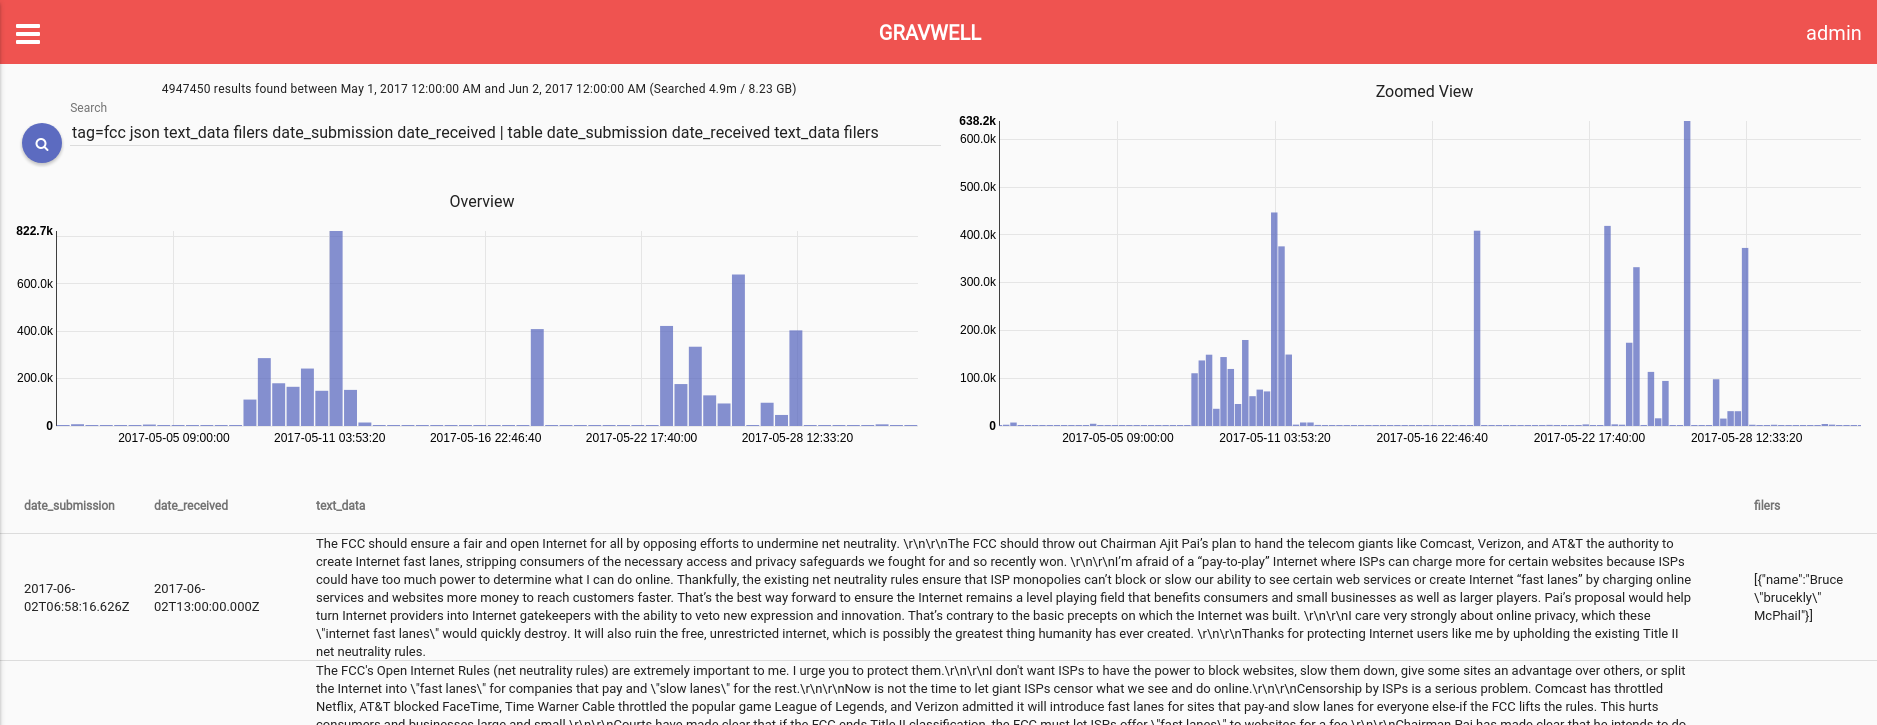
```tag=fcc json text_data filers date_submission date_received | table date_submission date_received text_data filers```
*note that any time you see text surrounded by ```, that means this was the raw Gravwell query used to generate an associated image, table, or other data presentation
Quick investigation reveals that the FCC supports a bulk upload of comment data for processing. We were curious about the batch submission data and wondered if it was possible to isolate batch submissions from organic submissions in some easy manner (other than frequency analysis on timestamps). Just because a comment was part of a batch submission does not mean it is less legitimate, of course, but it seems like it would be interesting to compare which way comments lean on the issue depending on where they originate.
I submitted a comment via the website which returned the JSON response of:
{
"confirm": "2017092769976124","received": "2017-09-27T20:23:55.271Z","status": "RECEIVED"
}
JSON data when viewing a comment entry includes a lot of superfluous fields but the properties of interest for this analysis are:
{
"confirmation_number": "2017092769976124","id_submission": "1092776404655","contact_email": "redacted@redacted.com","emailConfirmation": "true","express_comment": 1,"addressentity": {"city": "123 redacted ln","address_line_1": "","state": “ID","zip_code": "90210"},"filers": [{"name": "Corey Thuen"}],"date_submission": "2017-09-27T20:23:55.271Z","date_disseminated": "2017-09-27T21:00:01.000Z","date_received": "2017-09-27T20:23:55.271Z","text_data": "I am in strong support of title II classification of ISPs. I am passionate about neutrality on the internet and all packets regulated to be treated equally.",
}
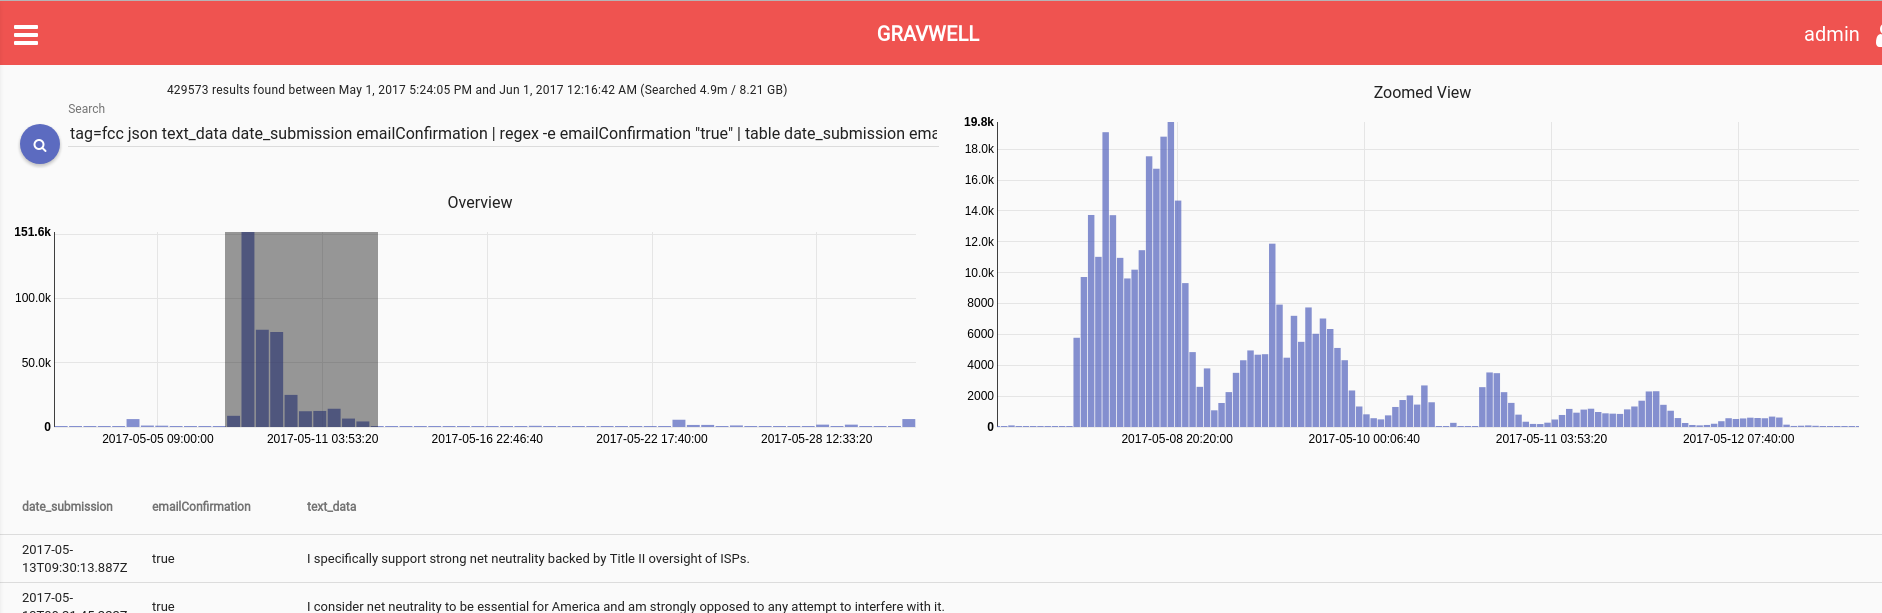
For the comment I submitted via the web interface, the server responded to my POST request with a “received” timestamp that exactly matches the date_submission and date_received timestamps of the final record for my comment. This pattern does not hold true for batch submissions. In the screenshot below, we zoom in on a batch submission group and see unusual timestamps ending with “00:00:000Z” times or in a different format of “2017-07-19T18:57:15+00:00”.
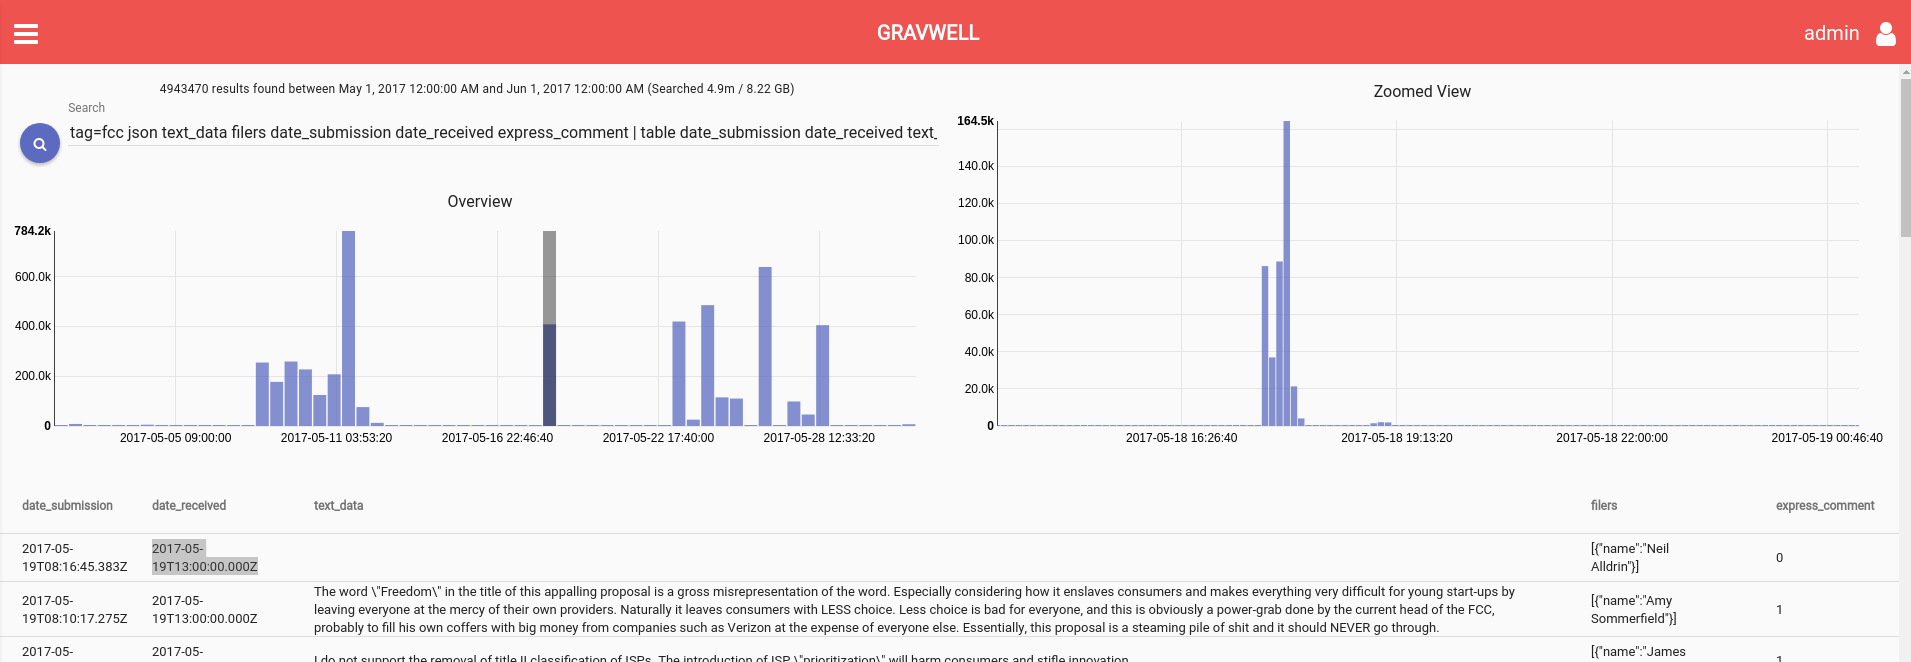
```tag=fcc json text_data filers date_submission date_received | table date_submission date_received text_data filers```
We were interested to see the number of records sharing a timestamp so we ran searches that count records by timestamp and broke them down by month. Since there are two relevant timestamps we did it for each date_submission and date_received. This makes it easy to see that these batch submissions almost always have a different timestamp format altogether and appear to be processed around T13:00:000Z. Seems like we’ve got a fairly quick way to isolate batch comments from organic ones.
|
count |
date_submission |
|
475482 |
2017-07-19T18:57:15+00:00 |
|
129281 |
2017-07-17T20:53:08+00:00 |
|
90673 |
2017-07-17T20:39:21+00:00 |
|
67018 |
2017-07-17T21:07:07+00:00 |
|
66841 |
2017-07-17T21:02:51+00:00 |
```tag=fcc json date_submission | count by date_submission | sort by count desc | table count date_submission```
Comment Content
Before we split up batch and organic comments, we ran a basic search over all comments to count by the actual text of the comment. The number of unique comments is significantly lower than the total number of comments -- only 17.4% of the 22,152,276 total.
|
Month |
Unique Comments |
|
May |
2053434 |
|
June |
66675 |
|
July |
1654726 |
|
August |
85343 |
|
Sept |
3751 |
```tag=fcc json text_data | count by text_data | count | text```
It’s not uncommon for commenters to take comment text from an advocate party, website, or new program and paste that into their comment submission. The fact that a comment shares text with 800,000 other comments does not reduce its legitimacy inherently, so we can’t remove comments on that basis alone for this investigation.
Here are the top comments broken down by month.
```tag=fcc json text_data | count by text_data | sort by count desc | table count text_data```
Comments are submitted with an email attached. The comments broken down by 10 most common domains by month are:
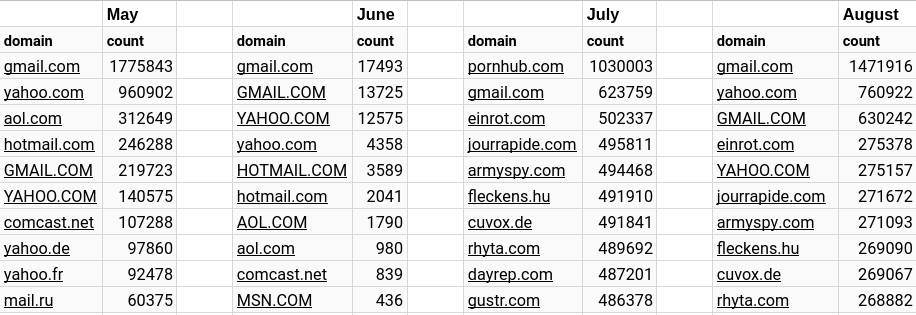
```tag=fcc json contact_email | regex -e contact_email "@(?P<domain>.+)" | count by domain | sort by count desc | table domain count```
Separating organic data
Of all the data submitted, we can think of no more “pure” a form other than a given individual proceeding to the FCC comment website and submitting a comment. We’ve termed these comments as the “organic” data but some work is required to identify and process only organic data. Using what we have observed about batch completion timestamp formats and processing time, we can remove those from our results and analyze the organic data.
Unfortunately, there are still bots that are using the website submission form API to submit requests in batches (rather than the actual batch submission API). This makes them appear as if they are comments submitted to the site when we filter based on the aforementioned techniques.
Like the rest of us, bot herders aren't immune to bugs in their code and sometimes push bad data to production. Except...unlike the rest of us they can't always roll it back because production is usually someone ELSE'S production. Here we see a bot start up with {STATE} and {CITY}. On the second try we get {STATE} and Orlando (Florida Man strikes again?).
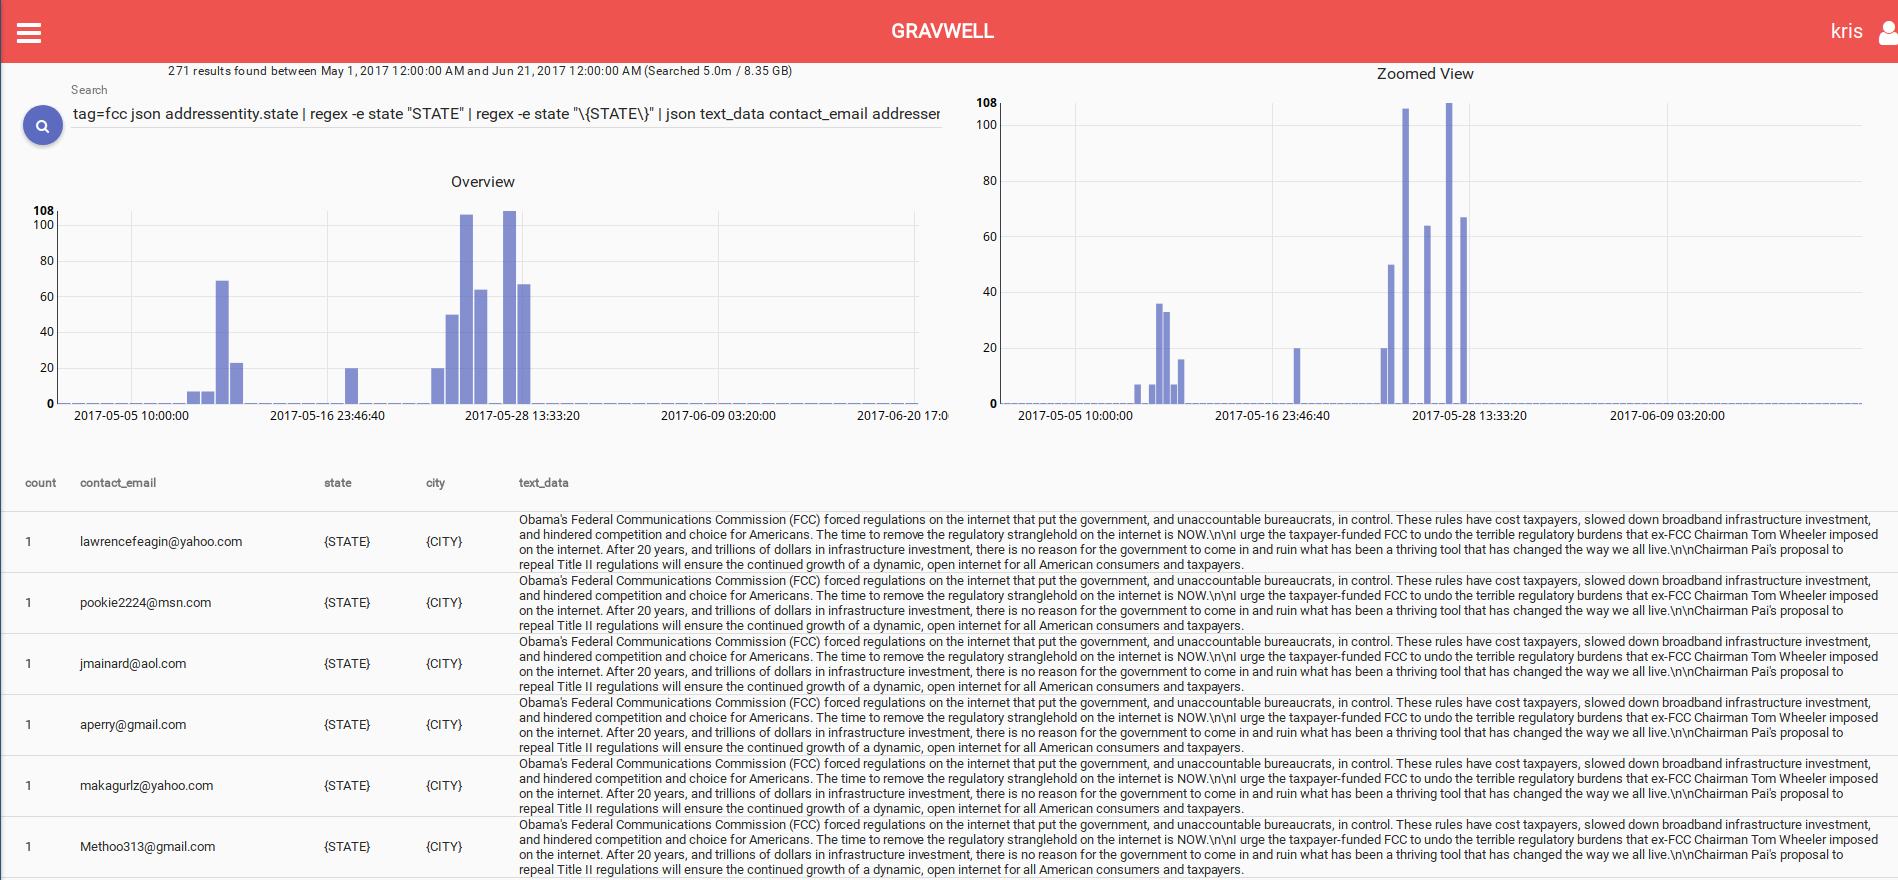
Third time is a charm and Florida Man gets his bot together and starts the submissions rolling.
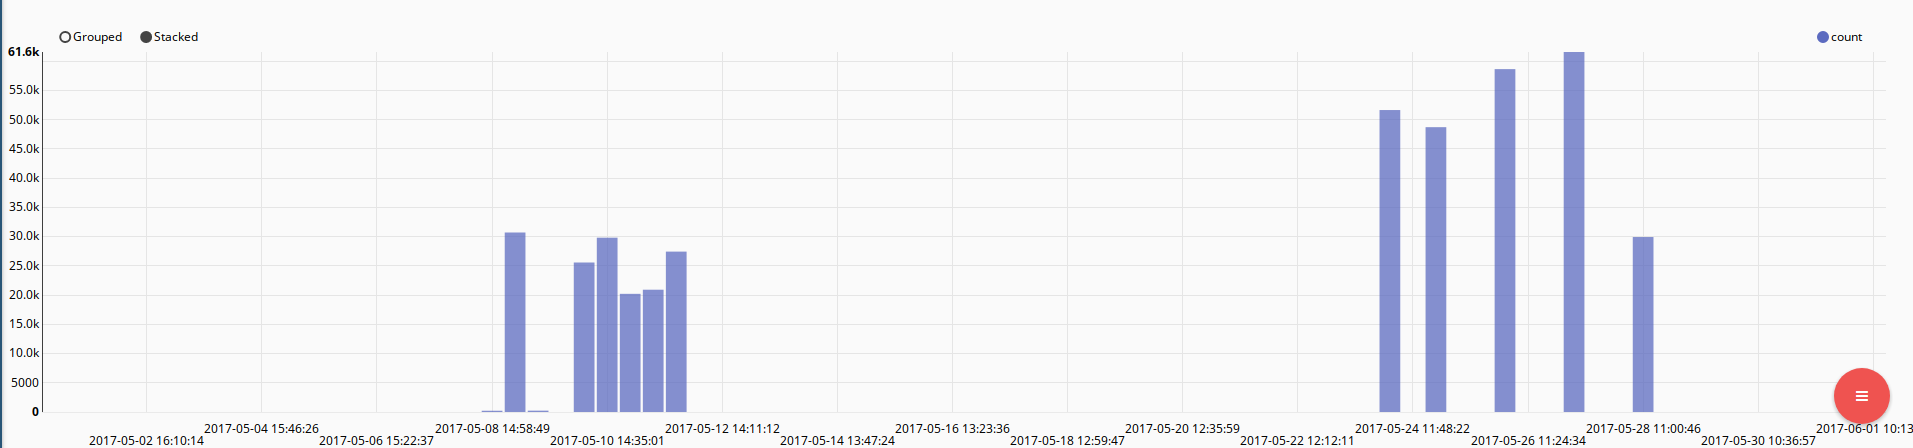
To find a different bot, we chart the frequency and then zoom in (the chart on the right) on one of the spikes. The submission rate jumps up and continues at this level -- easily distinguished as a bot.

```tag=fcc json text_data express_comment date_submission emailConfirmation contact_email date_received | grep -e express_comment "1" | regex -e emailConfirmation "true|false" | count by text_data | sort by count desc | table count text_data```
Thankfully, submissions by bots in this manner share common traits. In this instance we can see that the contact_email field was submitted in all caps, something not seen in more than 99% of organic submissions. Here is that same exact time frame with basic anti-bot filtering.
```tag=fcc json text_data express_comment date_submission emailConfirmation contact_email date_received | grep -e express_comment "1" | regex -e emailConfirmation "true|false" | regex -e contact_email "[a-z]+" | grep -v -e contact_email "maitreya.will" | table date_submission date_received contact_email emailConfirmation```
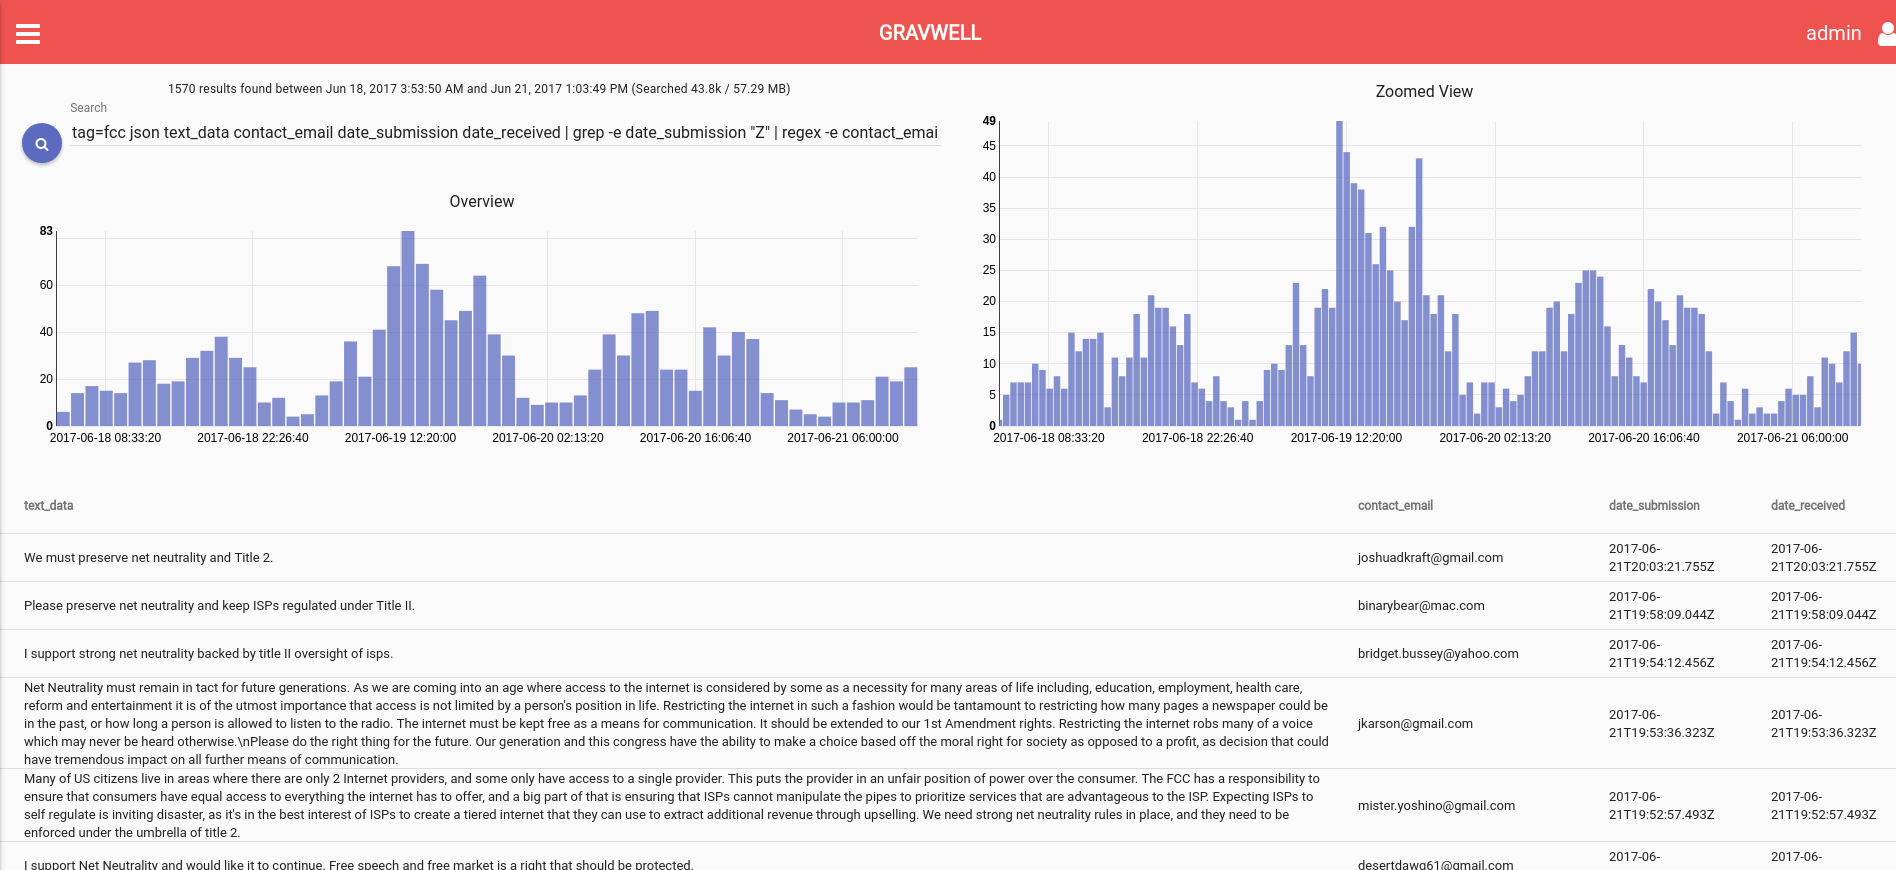
Now we’re getting somewhere. Let’s take it to the organic extreme and only go for the free range non-GMO grass-roots honest-to-goodness comments. Let’s add more filtering and only grab comments in which the submitter specifically requested email confirmation that the FCC had received their comment. If a spammer is harvesting legitimate email addresses in order to submit hundreds of thousands of generated comments, it is unlikely that they would want to alert hundreds of thousands of people that their email address is being used fraudulently. Therefore, it’s probably a safe bet that people who explicitly asked for a confirmation are likely real people making real comments (regardless of if they used a form letter or not).
These graphs are looking a lot more like we would expect actual humans to behave. Here we see an overview for May on the left and a zoomed in portion on the right -- anyone can clearly see activity dipping during the night to match human behavior.
```tag=fcc json text_data express_comment date_submission emailConfirmation contact_email date_received | grep -e express_comment "1" | regex -e emailConfirmation "true" | regex -e contact_email "[a-z]+" | grep -v -e contact_email "maitreya.will" | grep -v -e date_received "00:00.000Z" | table contact_email date_submission text_data```
Classifying comment stance
Now let’s break down top organic comments by month for comparison.
Just looking at the top comments for the overall raw count vs the count resulting from organic comments is interesting. The organic nature of the comments results in a lot more unique comments, however, and classifying the opinion of these comments is a more difficult task.
In the spirit of open disclosure and letting the data speak for itself, we provide the queries used to generate the dashboards from the top of this post. Unfortunately, these rely on regular expressions for classification, which are not ideal. We started down the machine learning path but had difficulty extracting enough negative comments to train the dataset. We would like to further explore this area as this is a fascinating application to machine learning. Classification of political leaning or stance on an issue based on content is an interesting problem space in general, not just for this particular problem.
Pro net neutrality:
```tag=fcc json text_data express_comment date_submission emailConfirmation contact_email date_received | grep -e express_comment "1" | regex -e emailConfirmation "true|false" | regex -e contact_email "[a-z]+" | grep -v -e contact_email "maitreya.will" | grep -v -e date_received "00:00.000Z" | regex -e text_data "((?i)(keep|support|preserve|maintain|maintaining|protect|retain|favor of).{0,30}(net )*neutrality)|(?i)(keep|support|maintain|maintaining|protect|remain|retain).{0,30}[Tt]itle (II|ii|2)|((?i)(not) (remove|repeal|end|reclassify) net neutrality)" | count | chart count```
Anti net neutrality:
```tag=fcc json text_data express_comment date_submission emailConfirmation contact_email date_received | grep -e express_comment "1" | regex -e emailConfirmation "true|false" | regex -e contact_email "[a-z]+" | grep -v -e contact_email "maitreya.will" | grep -v -e date_received "00:00.000Z" | regex -e text_data "((?i)(broad|extraordinary|unnecessary|heavy)[a-zA-Z ]{0,12}(regulation|regulatory|regulations))|((?i)I (support|am for)[a-zA-Z ]{0,10}(roll back|repeal|rolling back|repealing).{0,20}title (ii|II|2))|((?i)(harmful|bad|awful|restrictive)[a-zA-Z ]{0,10}title (ii|II|2))|((?i)(increase).{0,20}government( control)*)|((?i)(pass|passing) (bipartisan|bi-partisan| )*legislation)" | count | chart count```
Raw count:
```tag=fcc nosort | count | chart count```
Organic count:
```tag=fcc json text_data express_comment date_submission emailConfirmation contact_email date_received | grep -e express_comment "1" | regex -e emailConfirmation "true|false" | regex -e contact_email "[a-z]+" | grep -v -e contact_email "maitreya.will" | grep -v -e date_received "00:00.000Z" | count | chart count```
You can also view our results in a google spreadsheet.
See Gravwell n action - Schedule a demo and we'll answer any questions you might have about the platform, or data analytics in general.