Gravwell Community Edition is perfect for monitoring your home network. With a generous 2GB/day ingest quota, you can capture netflow records, DNS requests, WiFi hotspot associations, and more. In this blog post, we’ll show how to ingest and analyze netflow records. We’ll assume you’ve already set up a Gravwell instance as described in the quickstart; for this post, we’ll assume the Gravwell instance is at 192.168.1.52. Your instance will almost certainly be different, so be sure to substitute your own information.
Configure the Netflow Ingester
For simplicity, we are going to run the Netflow ingester on the same machine as Gravwell. Since Gravwell is already installed, the installer should be able to pick up the correct information to connect to the ingester from the existing gravwell.conf file.
If you installed Gravwell from our Debian repository, you can simply run the following to install the ingester:
apt-get install gravwell-netflow-capture
Otherwise, just fetch the Netflow installer from our Downloads page, unpack it, and install it:
curl -O https://update.gravwell.io/path/to/current/ingester/goes/here
tar xjvf gravwell_netflow_capture_installer_XXXXXX.tar.bz2
sudo bash gravwell_netflow_capture_installer_XXXXXX.sh
Note: Be sure to check the downloads page to get the latest version of the Netflow ingester installer; we may have uploaded a later version!
The installers shouldn’t ask any questions; they can find the information they need from the existing Gravwell configuration. By default, the installers will listen for incoming Netflow v5 records on port 2055, ingesting them with the tag “netflow”.
Generating Netflow
Depending on your network environment, you may have several options for generating Netflow. I use a FreeBSD system as a router, so I have configured it to export Netflow records for the Internet-facing interface and send them to Gravwell. If you have a reasonably competent switch or router, it may be able to export Netflow for you as well.
To keep this blog post simple, I’ll show how to set up fprobe on a Debian Linux system, in this case my laptop. If you’re running Linux on your router, you could use this to monitor your whole network, but since I’m installing it on my laptop I’ll only be capturing a portion.
I install fprobe with apt-get:
apt-get install fprobe
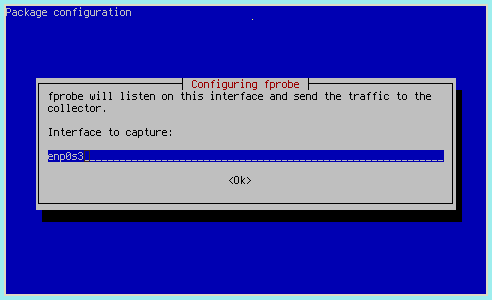
Set it to capture on the appropriate interface:
And direct it to my Netflow ingester, in this case on 192.168.1.52 port 2055:
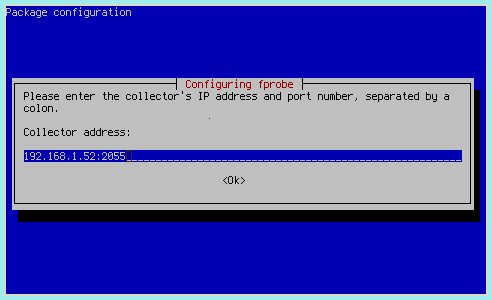
Once installation completes, fprobe will begin sending Netflow records to my Netflow ingester, which will in turn send them to the Gravwell instance.
Analyzing Netflow
Gravwell includes a search module specifically designed to parse binary Netflow records. The full documentation is available on our documentation site, but I’ll give a few examples in this section to give a feel for how it works.
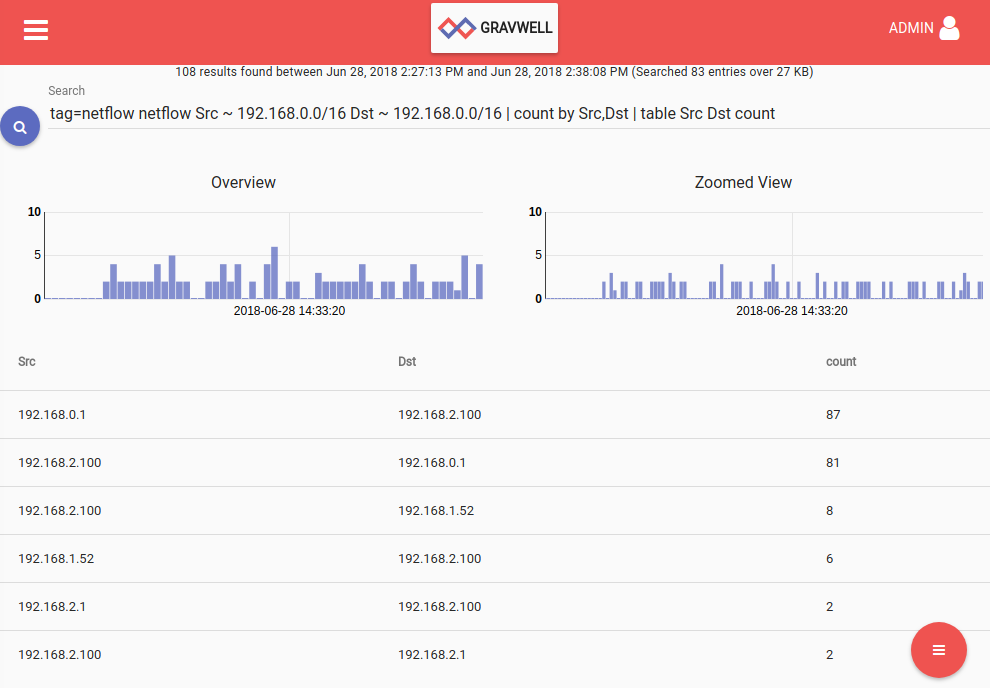
The following search will show which machines are talking within my internal network (192.168.0.0/16 subnet):
tag=netflow netflow Src ~ 192.168.0.0/16 Dst ~ 192.168.0.0/16 | count by Src,Dst | table Src Dst count
Because the netflow records are coming from my laptop (192.168.2.100), we only see it communicating with the router (192.168.2.1 and 192.168.0.1) and my Gravwell instance (192.168.1.52):
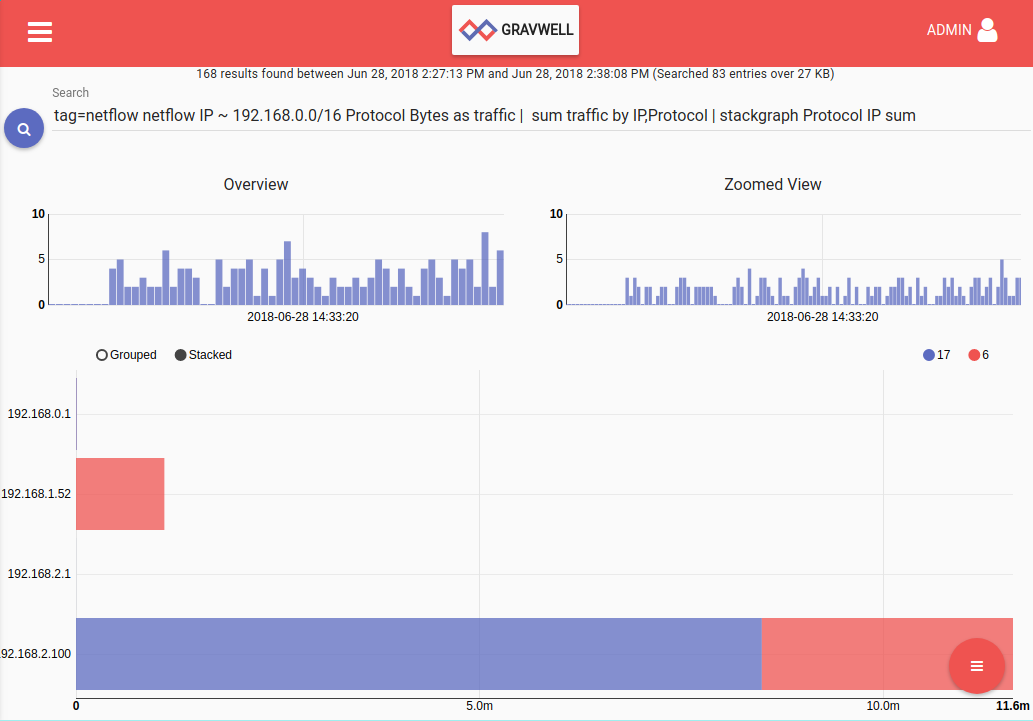
We can also see what protocols my systems are speaking with a search that counts the number of bytes by Protocol/IP pairs:
tag=netflow netflow IP ~ 192.168.0.0/16 Protocol Bytes as traffic | sum traffic by IP,Protocol | stackgraph Protocol IP sum
The graph below shows that my laptop, 192.168.2.100, has the most traffic (unsurprising), with about 8 MB of that traffic in the form of UDP (Protocol 17) and 3 MB in TCP (Protocol 6):
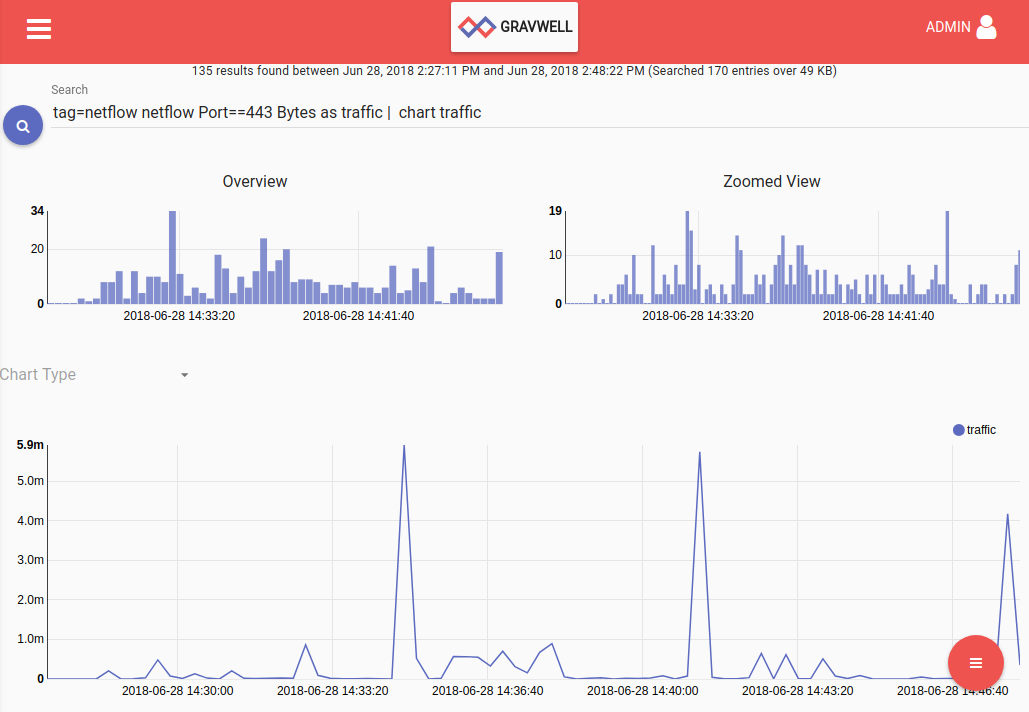
This search will show how much HTTPS traffic has passed over the given time period:
tag=netflow netflow Port==443 Bytes as traffic | chart traffic
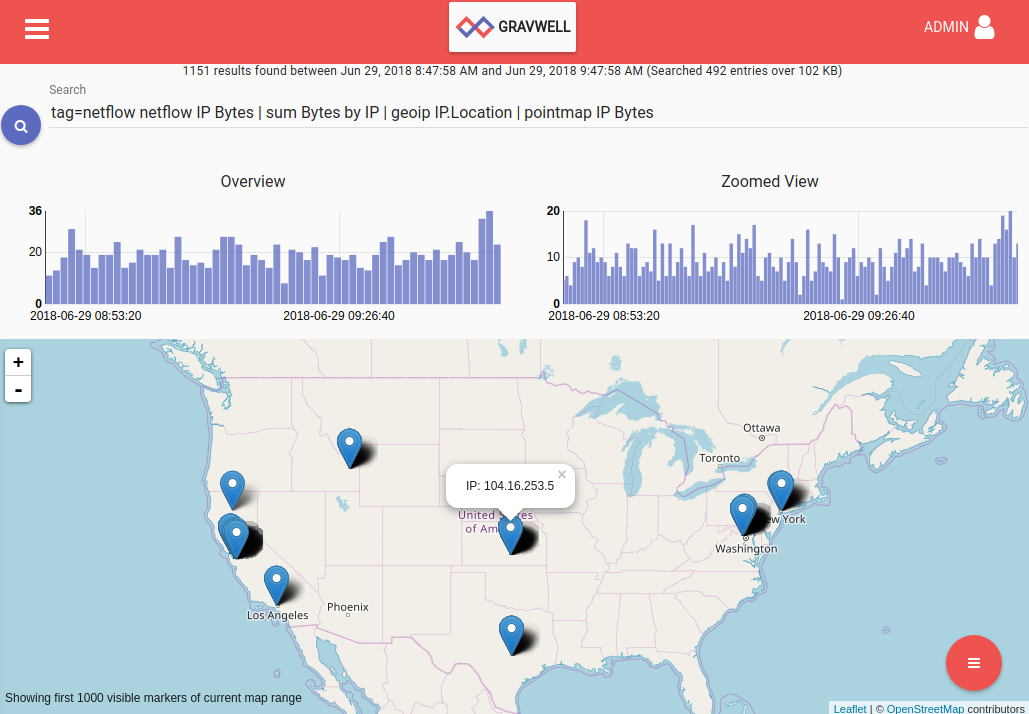
Finally, this search will count up how many bytes were transferred to each IP and plot the locations of the IP addresses:
tag=netflow netflow IP Bytes | sum Bytes by IP | geoip IP.Location | pointmap IP Bytes
(You’ll need the MaxMind GeoLite2 database uploaded as a resource named “maxmind” for this to work; fetch the database in MaxMind binary format from geolite2, unpack it, and upload it)
Clicking on a point in the map will show the number of bytes transferred to/from that IP:
IPFIX
The Gravwell Netflow ingester can also ingest IPFIX records by adding another collector to the configuration file:
[Collector "ipfix"]
 Tag-Name=ipfix
 Bind-String="0.0.0.0:6343"
 Flow-Type=ipfix
After restarting the ingester, configure your IPFIX generator to direct records to port 6343 on your ingest machine. YAF (YAF Tool) can be used on a Linux system to generate some IPFIX records for testing.
Once records are flowing, you can use the IPFIX module to parse the records and extract fields. Refer to the documentation for more information and examples.
Use Case Example: Keeping tabs on your Windows file shares
If you're building a Home Operations Center, you'll certainly want to know who's poking around your network file share. For those of us who haven't welcomed their new data overlords and pushed everything into the cloud, some basic netflow searches can yield results.
Let's start with a straightforward search that shows us a quick graph of which systems are communicating with our Windows server. For this example we're looking at a 10.0.0./24 network that has a windows file share running on 10.0.0.1. This search includes a sum module to weight our force directed graph edges based on how many bytes were transferred between the server and the client. Darker edges between nodes mean more active file share use.
tag=netflow netflow Src Dst Port == 445 Bytes | sum Bytes by Src,Dst,Port | table Src Dst Port sum
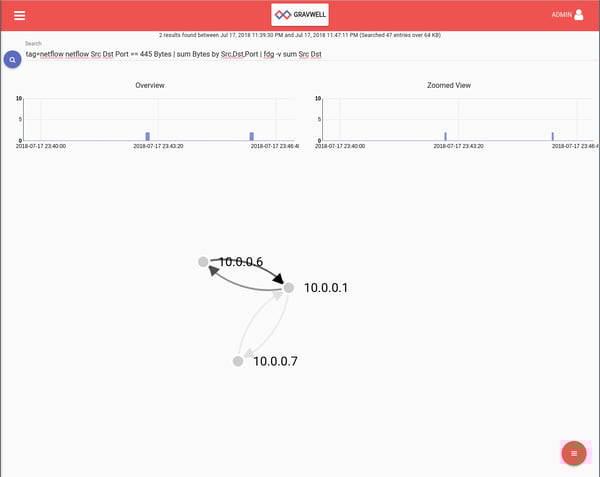
Looks like we're seeing only two clients in this time period. One of them more heavily using the file share than the other. This might be a view we'd like to add to a dashboard, especially for small networks where noticing a change would be easily done at a glance. If you're interested in doing netflow monitoring a larger homelab setup or at work, relying on your subconscious to notice changes in the graph is probably insufficiently actionable.
Let's take this chance to explore how the resource system within Gravwell can be used to create network whitelists. In this instance, 10.0.0.6 and 10.0.0.7 are "approved" clients to the file share so we'll whitelist them and create a table that tracks any violations to the whitelist. For this post, we'll go through this manually but the integrated orchestration and search scheduling system can be set up to create these types of lookup resources automatically. This system is primarily script-driven for now but big usability improvements are coming down the road.
First, let's get the results in a table which we can export as a "Lookup table" for use in our resource system. We invoke the unique module because we only want a list of each flow that has been seen, not the entries of every flow.
tag=netflow netflow Src ~ 10.0.0.0/24 Dst ~ 10.0.0.0/24 Port == 445 Bytes | unique Src Dst Port | table Src Dst Port
Use the search results menu button to choose the download option, select Lookup data, and save to disk. This saves the results of the search in a format that's usable by the Gravwell lookup system and offers better performance over a CSV, but you could easily create a whitelist CSV by hand (or using other tools) for use in Gravwell.
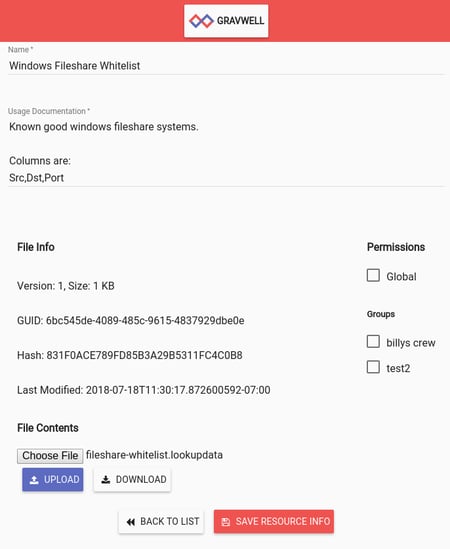
With the results of our search saved, let's get that lookup table into the resource system. Using the main menu, navigate to 'Manage Resources' and use the floating action button to choose "Create New". Fill out the appropriate info and save. Then, we'll upload the aforementioned file. We're working on exporting directly to the resource system but for now this is a bit of an extra step. Afterward, your resource screen should look something like this:
With a network communications whitelist uploaded and ready to go we can now issue a search that checks that whitelist for violations and puts the results in a table for us to review. The big change here is the lookup module. This module is traditionally used to enrich data by enabling static lookups, such as resolving IPs to hostnames. Here, however, we are using a trick: the -v option will "invert" the logic (similar to grep -v) and pass through any entries that FAIL to match. This results in the whitelist behavior that we desire. Anything that does not match what is in this resource will be passed through and entries that do match will be filtered from the pipeline.
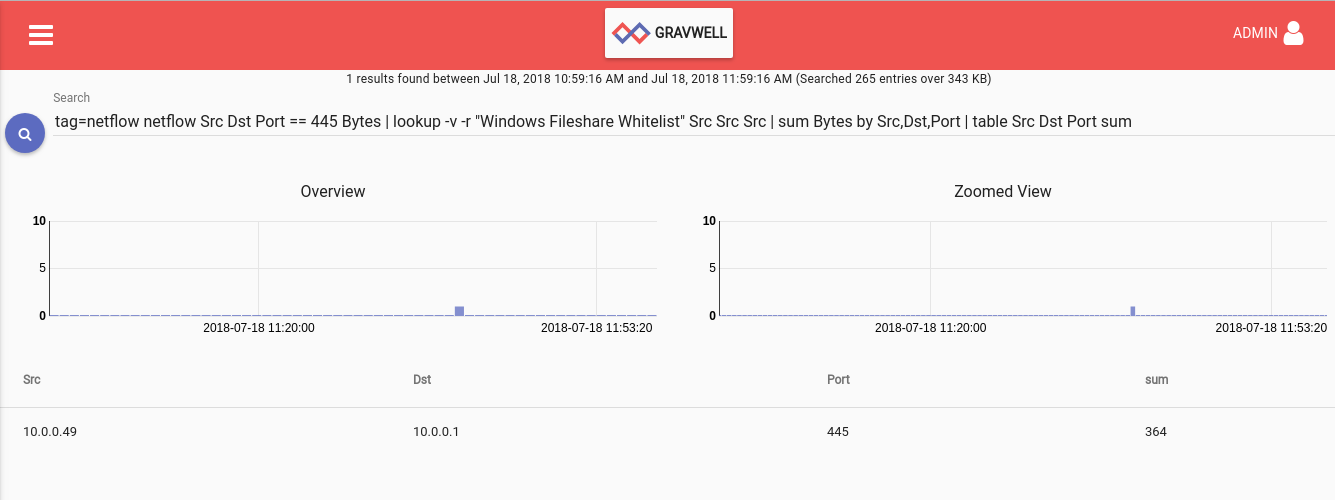
tag=netflow netflow Src Dst Port == 445 Bytes | lookup -v -r "Windows Fileshare Whitelist" Src Src Src | sum Bytes by Src,Dst,Port | table Src Dst Port sum
Giving that search a run we see no violations, huzzah. Now....let's go ahead and connect up a cool new IoT device. In this totally hypothetical and not-at-all-real scenario, let's say it's a smart oven that forces you to accept a EULA before you can even bake a flippin' pizza. We can search our dhcp logs (a topic for another day!) to see that the new device got an address of 10.0.0.49. First thing's first, let's find out what kind of network communications this fancy new widget is conducting. A basic filter on the Src will tell all.
tag=netflow netflow Src == 10.0.0.49 Dst Port Bytes | sum Bytes by Src,Dst,Port | fdg -v sum Src Dst
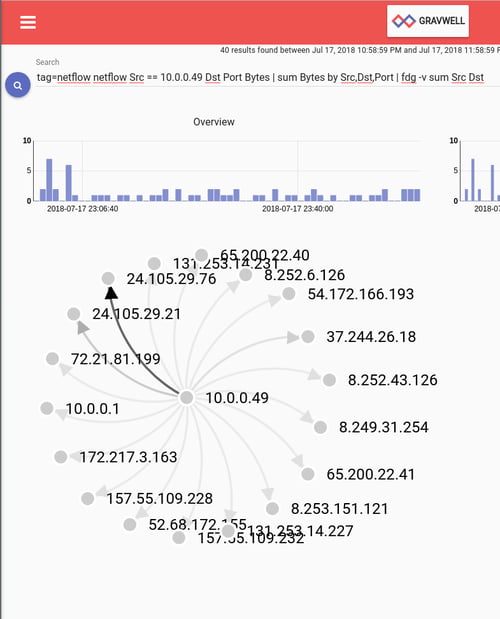
Oh my. That's a lot of reaching out but looks like most of it is to a single IP. Let's ignore the internet for now and instead focus on those internal network communications. One generally wouldn't think an oven would talk to anything else on the network but it is 2018, after all. Let's investigate internal communications.
tag=netflow netflow Src == 10.0.0.49 Dst ~ 10.0.0.0/24 Port Bytes | sum Bytes by Src,Dst,Port | table Src Dst Port sum
| Src | Dst | Port | sum |
|---|---|---|---|
| 10.0.0.49 | 10.0.0.1 | 445 | 246 |
We see DNS traffic as expected but, what's this?! Our IoT oven is cooking up a suspicious recipe and apparently the ingredients are our files! Time to add some firewall rules and think about maybe finally getting around to creating that untrusted wifi network for times such as these.
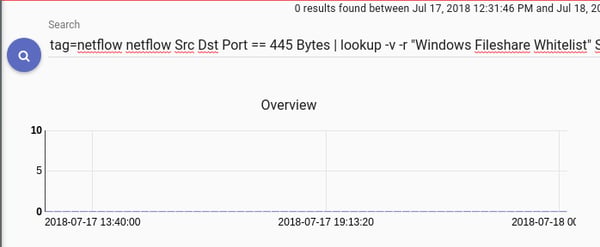
Now, for posterity, let's re-visit that the network whitelist we had previously created:
Indeed, there's the oven, sticking out like a sore thumb. Our manual investigation was unnecessary; the whitelist of approved devices made it easy to catch the rogue device!
Conclusion
Netflow is a great way to keep an eye on your home network traffic using Gravwell Community Edition. Stay tuned for further blog posts that will help you gain even more insight into your network traffic!
Response to the Community Edition has been great so far and it's exciting to see community members creating tools to help each other. If you're interested in trying Gravwell out at work, you can register for an unlimited data (but limited time) trial using the big red button below.
Happy hunting!