Gravwell 4.2.0 includes a lot of great stuff--including a snazzy new default theme--but perhaps the coolest new feature is the Data Explorer. Data Explorer is the easiest way to come to grips with your data: it can automatically determine the format of your entries, display them in an easy-to-read way, and help you filter through that data to find what you're interested in. In this post, we'll point the Data Explorer at some Apache logs and filter down to one particular subset of the logs, then show how to pivot the results from Data Explorer into a dashboard.
Get Apache Logs into Gravwell
It's really easy to get Apache logs into Gravwell. Just install the File Follow ingester and put this in the config file:
[Follower "apache"]
    Base-Directory="/var/log/apache2/"
    File-Filter="{access.log}"
    Tag-Name=apache
Check out the ingesters documentation for more info on configuration.
Data Explorer
Let's start exploring this data from a total blank slate. First, we click Data Explorer in the main menu, then pick the apache tag from the list it shows: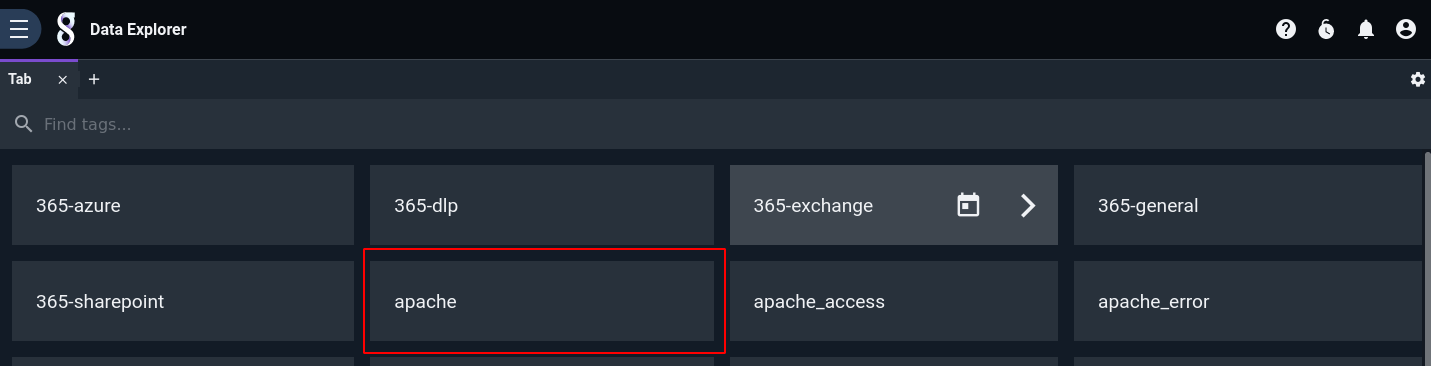
Data Explorer doesn't know anything about what's in the apache tag yet, so it tries a bunch of different ways to parse the entries and presents us with several options. It's our job to browse through these options (ranked by "confidence", Data Explorer's estimate of extraction quality) and select the one that looks most correct to us. Although the fields module does a pretty good job, we chose the regex version instead because it gives good names to the individual components of the log entries: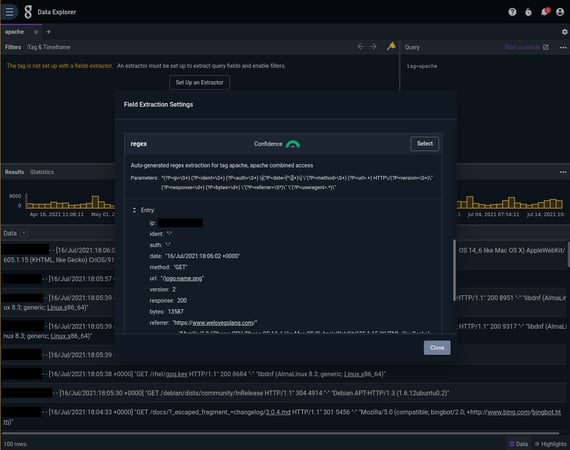
Now we see a nice display of each log entry, with individual fields named and extracted: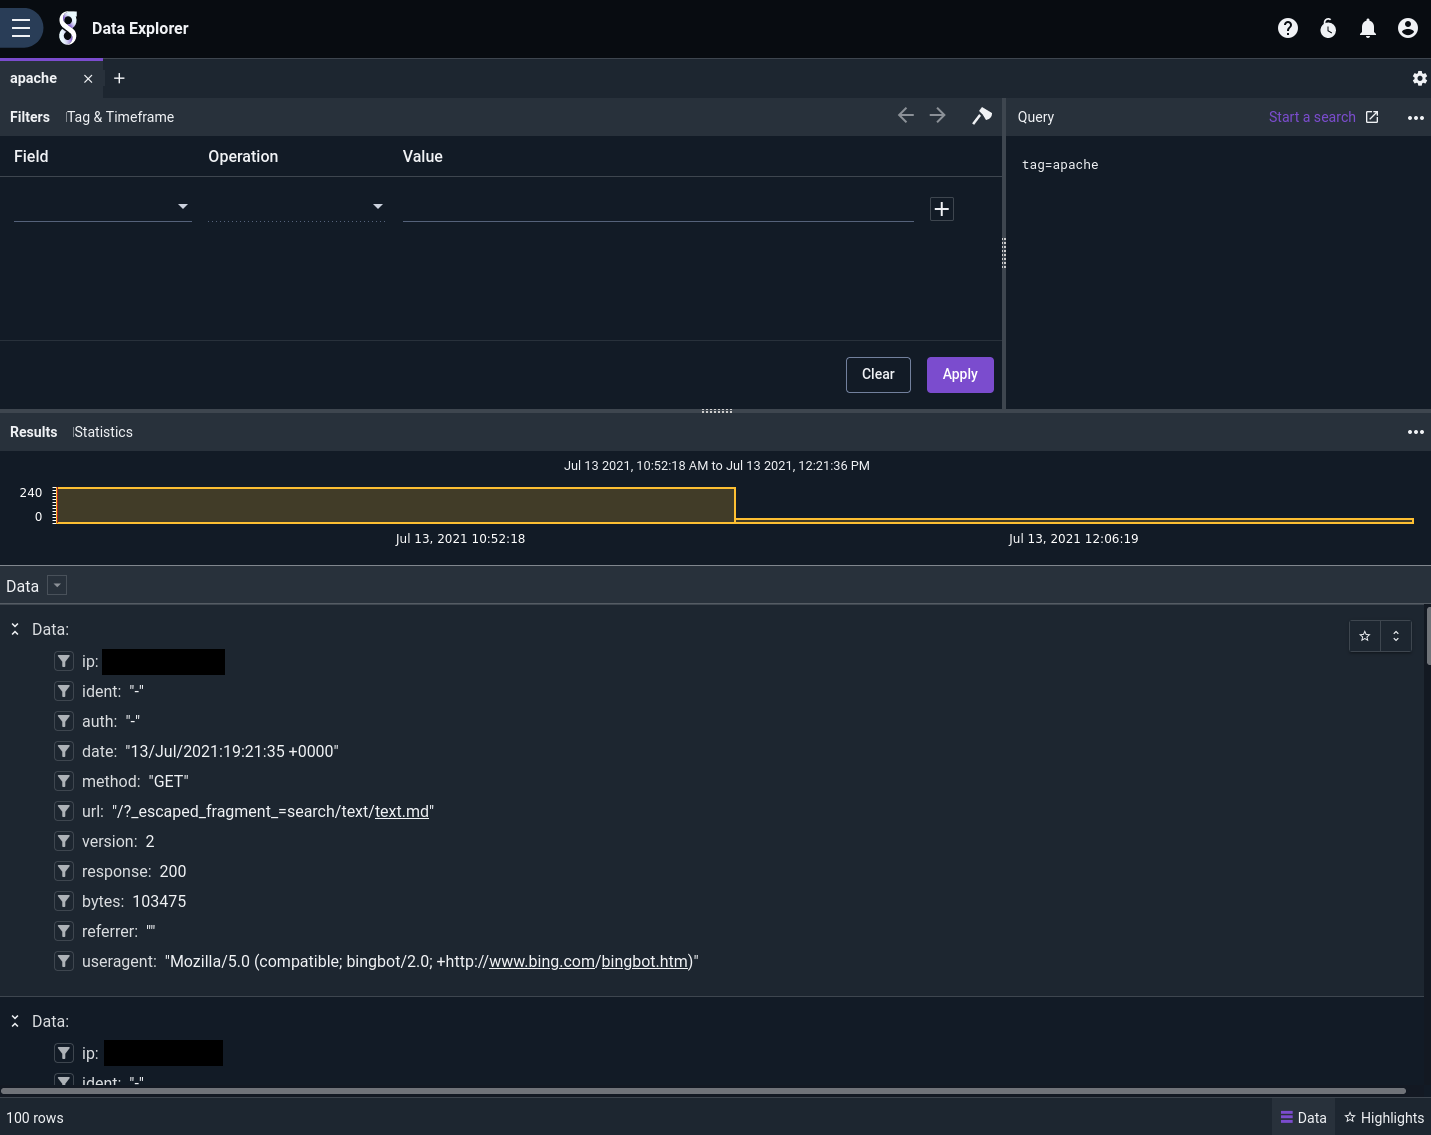
Suppose we want to see if any Gravwell components or services are having persistent problems. We know Gravwell components include "Gravwell" in the user agent string, so we're going to filter down to only those log entries where the response code is not 200 and the user agent string contains "Gravwell".
Add a filter to get rid of success codes (HTTP 200):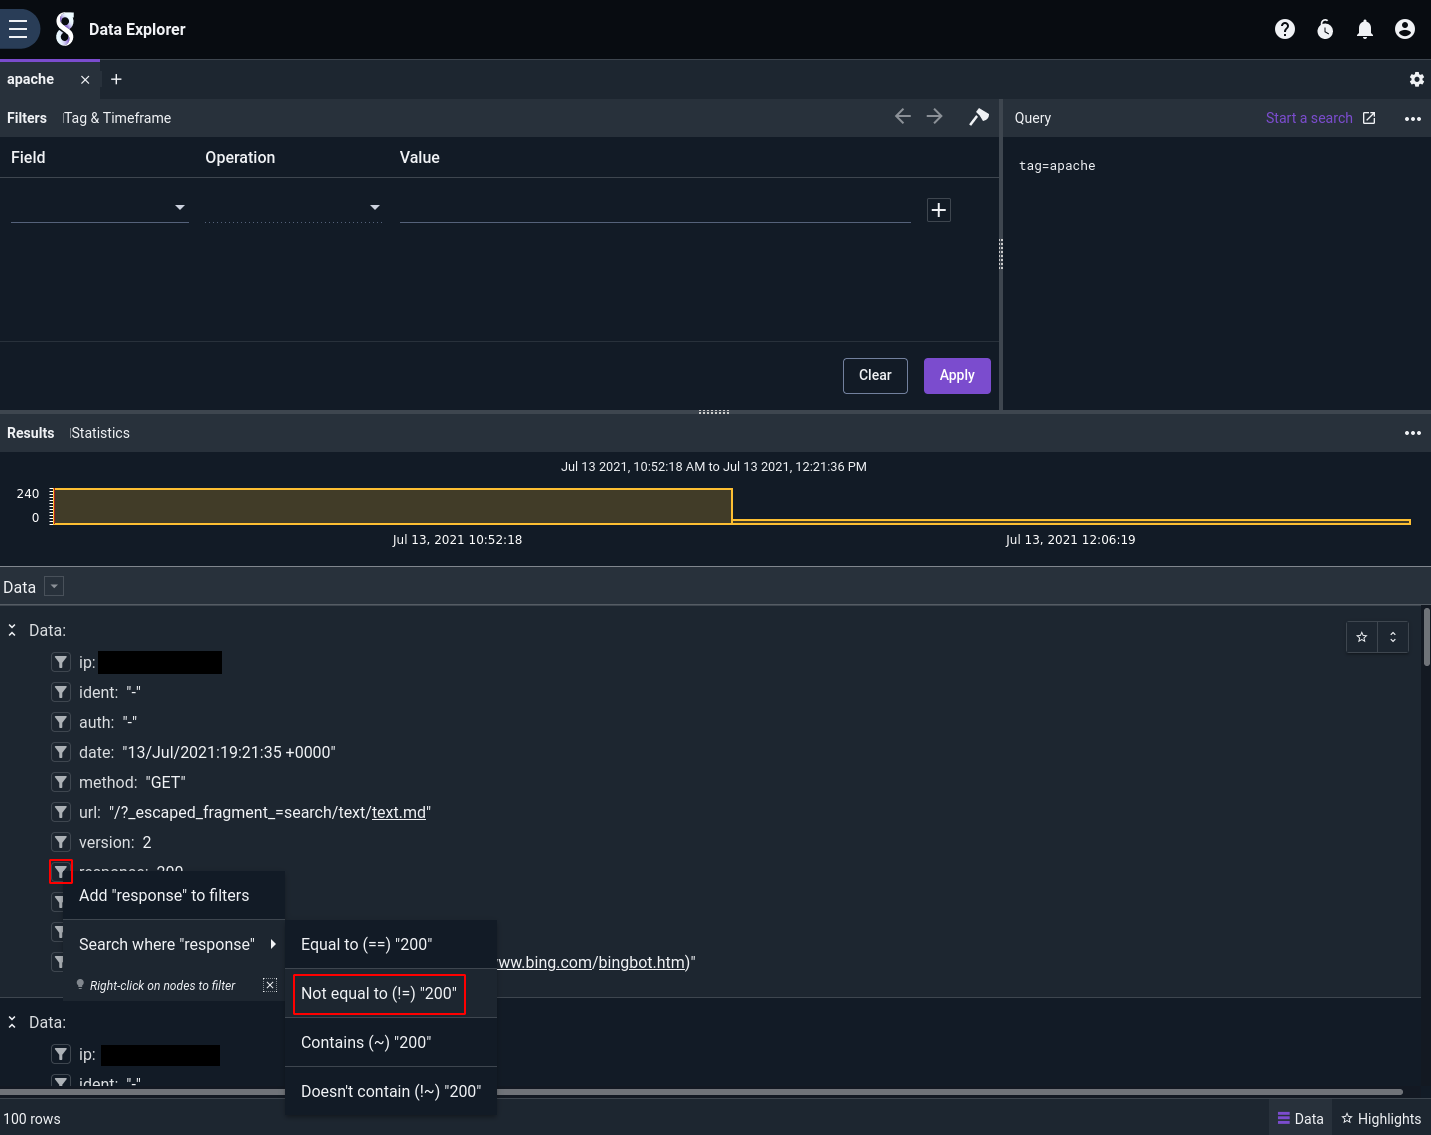
Then we click the filter icon next to the "useragent" field on any entry, click 'Add "useragent" to filters', and manually fill out the Operation and Value fields in the filters pane: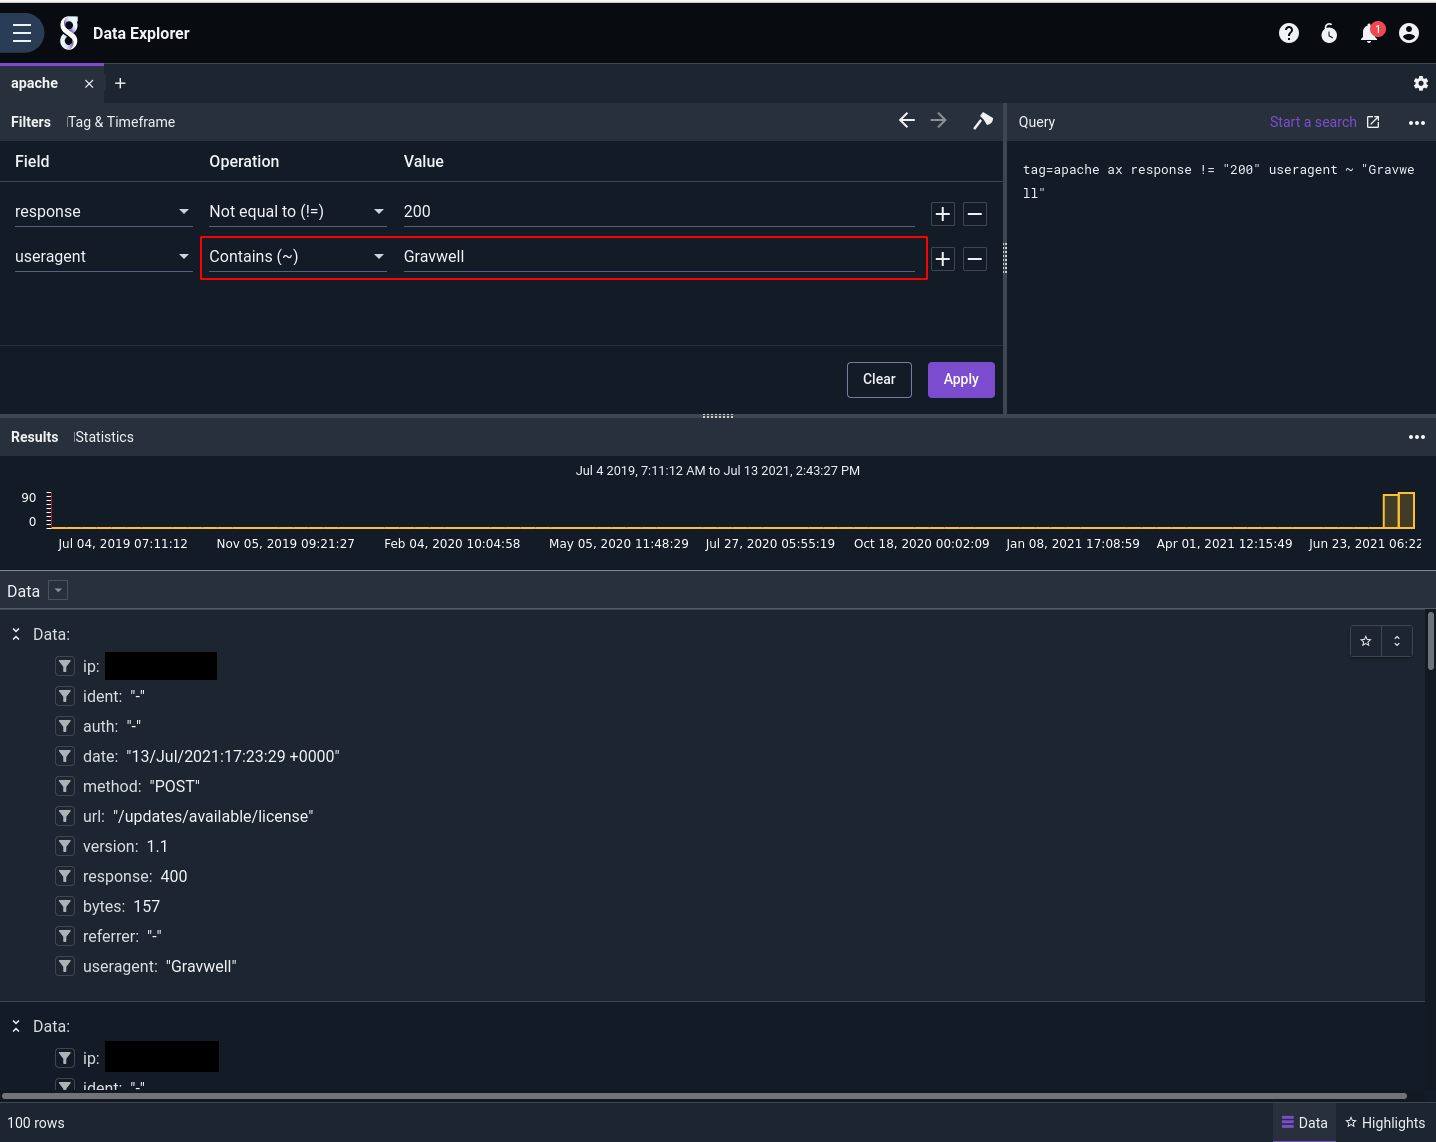
One problem: now we see a lot of entries getting a 400 response on the /updates/available/license URL. This happens to be part of a new automatic license update system we're testing, and the 400 responses are expected, so let's just filter out that URL: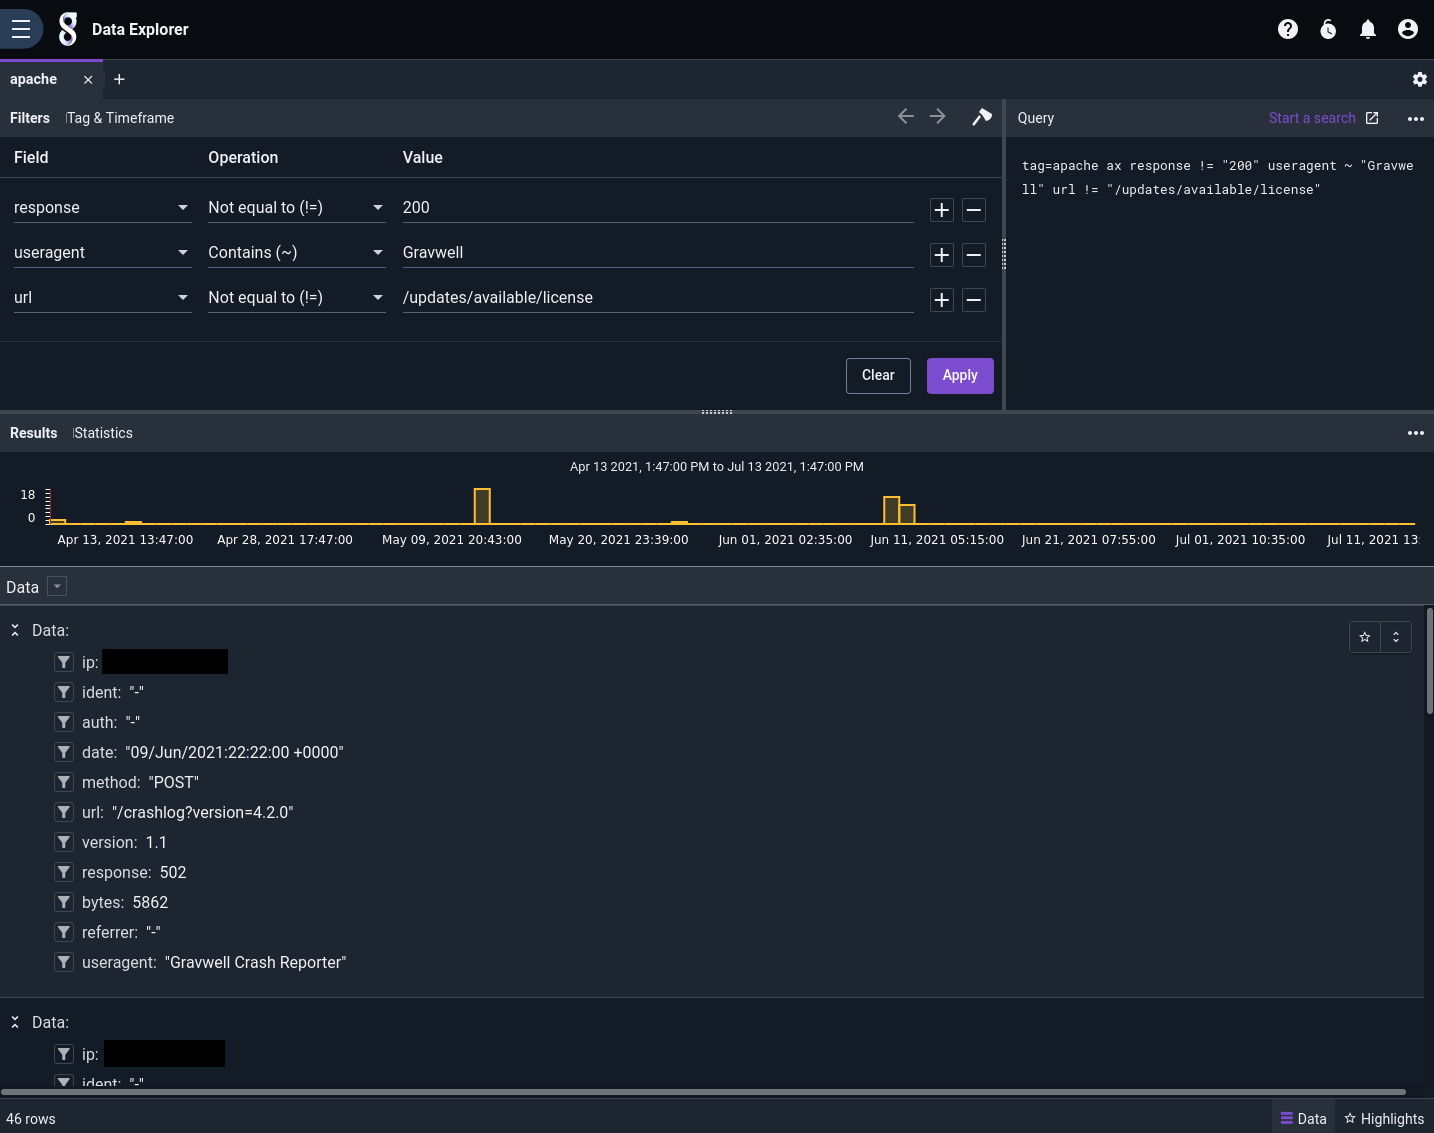
Now that we've filtered out the extra info, we're left with some entries showing that the automated crash reporter component was failing to upload crash reports on June 9. That's worth looking into: the server's disk may have filled up, for instance.
Pivoting from Data Explorer
Once we've found something useful within the Data Explorer, we can easily pivot off into the traditional search interface and polish up the query into something for a dashboard.
If you click 'Start a search' near the upper right corner of the Data Explorer UI (above the query display), it will pre-populate the current filters into a new query form: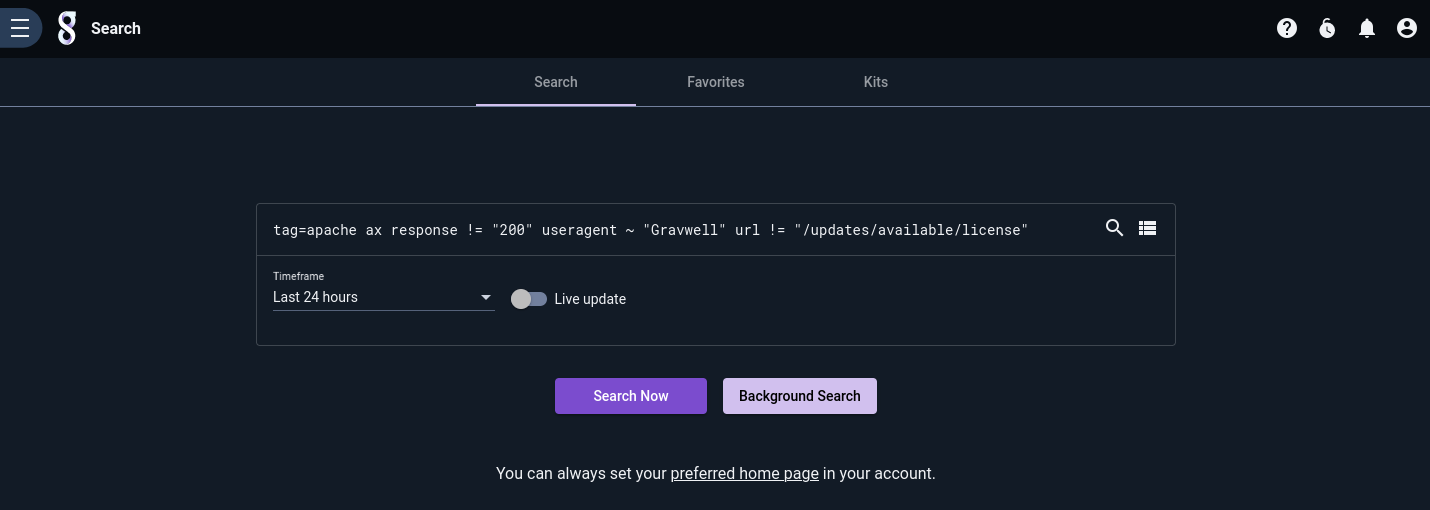
If we add the table renderer to the end and expand the time range a bit, we can see the same entries as in Data Explorer: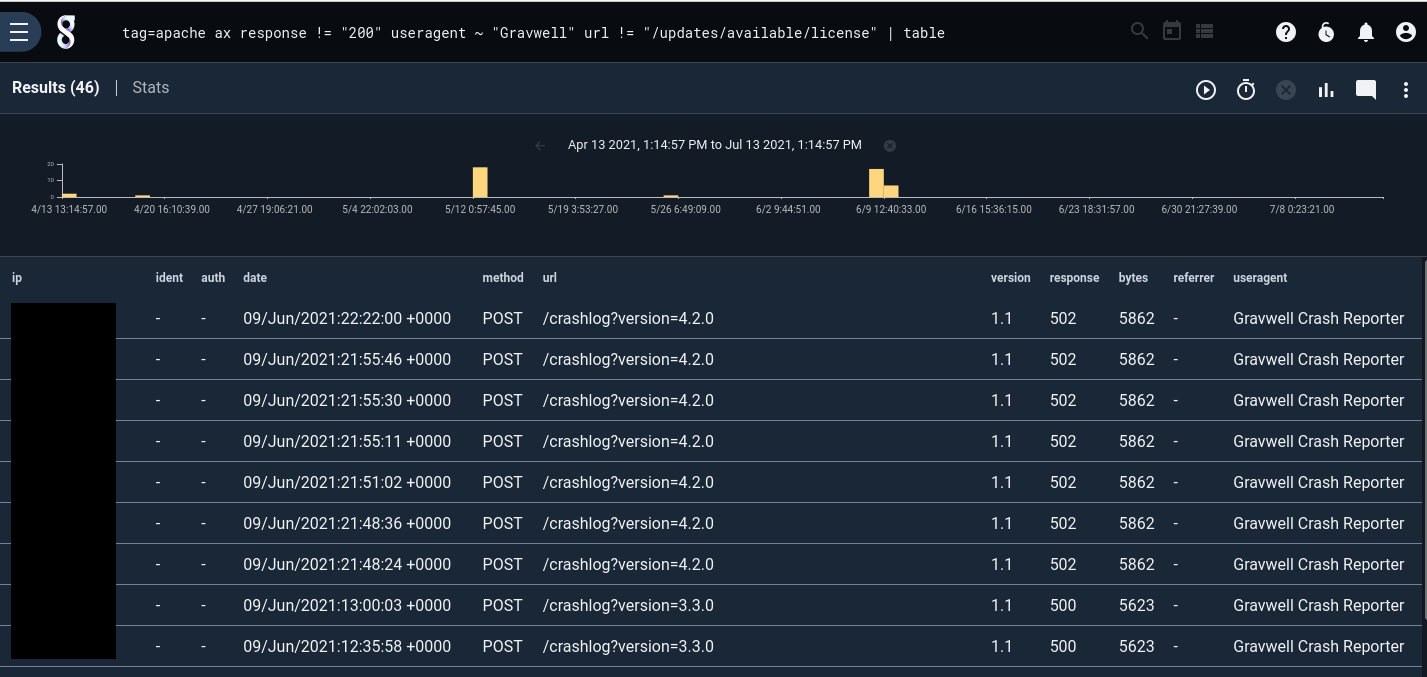
After a little bit of tweaking, we add the tile to a dashboard, along with some other queries we've cooked up: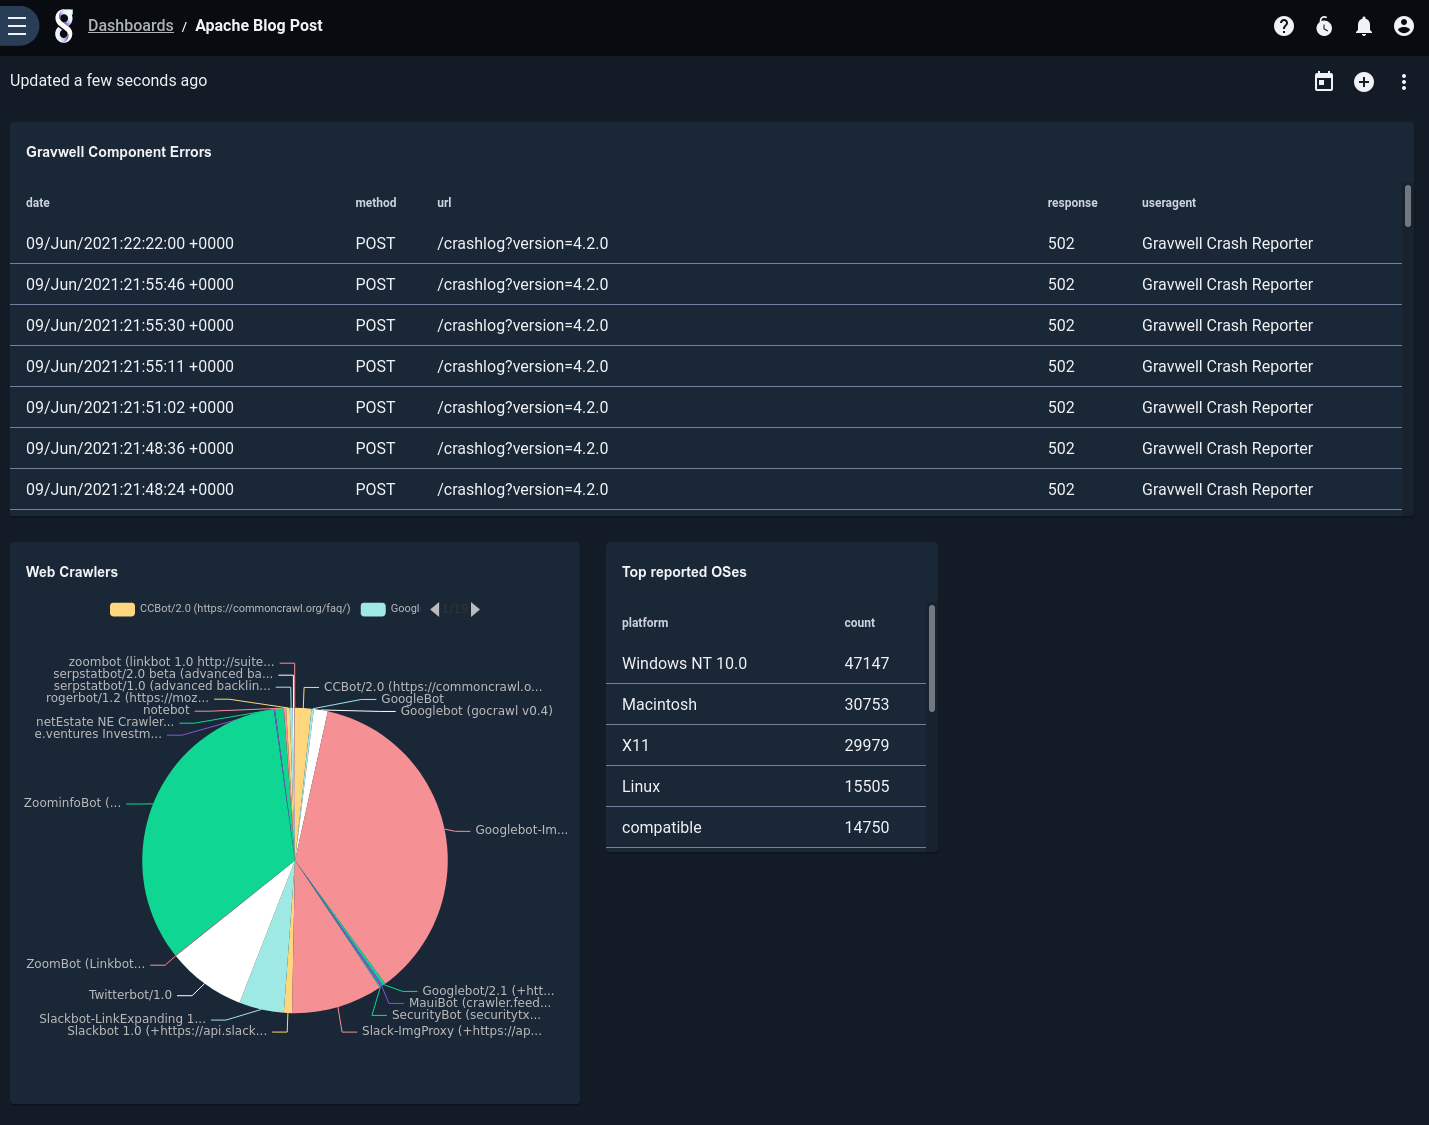
Conclusion
Gravwell's new Data Explorer tool can help you understand your data faster than ever, with automated data-type detection and user-friendly filtering. As this post shows, you can rapidly iterate through your data until you find the interesting stuff, then pivot your results out of Data Explorer and into a dashboard for future use.