Welcome back to Gravwell HQ! Today we bring you the second post in our two-part blog series on building IPMI ingest and analysis tools. In part one we walked through building an ingester from scratch, and gave an overview of IPMI. In this post, we’ll be taking a tour of how we made our officially supported Gravwell IPMI kit. We’ll go through everything from macros, queries, templates and dashboards, to kit packaging. There’s a lot of great info to cover, so let’s get started!
What’s in a Kit?
Kits are pre-built bundles of dashboards, search queries, resources, and more. If you’ve ever built up a series of queries and a dashboard, and wished you could just ship them over to a colleague, or share them as a whole with other users on the system, kits are for you. Kits can contain all of the objects that can be saved in Gravwell, such as macros and playbooks, to create a simple distributable collection. Kits are versioned and can have dependencies. For example, our CoreDNS and Netflow kits both depend on the Network Enrichment kit, which provides a number of helpful resources for decoding network data into human-readable formats.
Gravwell publishes kits to help you get to an analysis posture faster. With a fresh install of Gravwell, you can set up an ingester and deploy a matching kit in minutes, then start analyzing data without having to write a single query.

Having installed all the kits, the IT department gets back to work
We already have an IPMI ingester, so now let’s write a kit to go with it.
Our Kit Goals
Our IPMI kit will be similar to our other kits: one or two “overview” dashboards, a target-specific dashboard (in this case a target is an IPMI device) that is essentially the same as our overview dashboard but restricted to a single device, and a playbook. We’ll also include an IPMI macro ($IPMI) so that anyone installing it can point the kit towards their IPMI data, regardless of which tag it was ingested under.
We shouldn’t need any resources, and we don’t have any dependencies, so that helps simplify things.
Building the Kit
Macros
Since we’re writing our queries on our own system with the intention of distributing them in a kit, we need to know what tag the end user’s IPMI data is in. That could be, well, anything (our illustrious CTO prefers to ingest all data into the “getbacktowork” tag), so to facilitate portability, we’ll install a macro named $IPMI, and use it to reference as the tag, and set the default value to “ipmi”. As a result, all of our queries will start with:
tag=$IPMI ...
We create the macro by going to the macros page (Menu->Tools & Resources->Macros), and clicking “Add”:
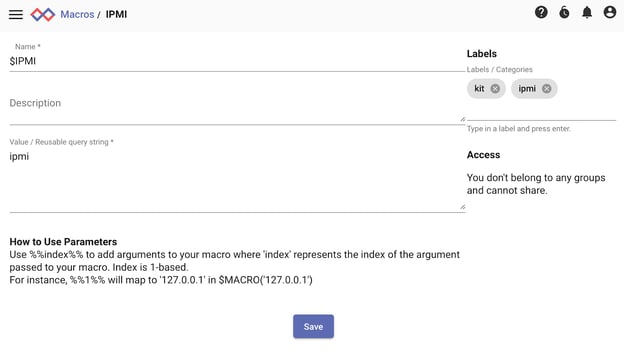
Our macro has a default value of “ipmi”.
A special note: We added two labels to this macro -- “kit” and “ipmi”. We’ll do that to every single item we create -- macros, queries, dashboards, etc. While this isn’t necessary to build a kit, it does help with organization and searching for kits, and it will help us when it comes time to build the kit. All official Gravwell kits are labeled in this way.
Queries and Templates
With our macro in place, we’ll move on to queries. We’ll limit the discussion here to just one, but all of our queries are built in the same way.
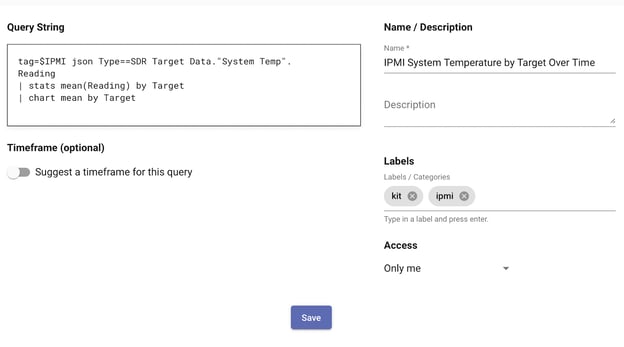
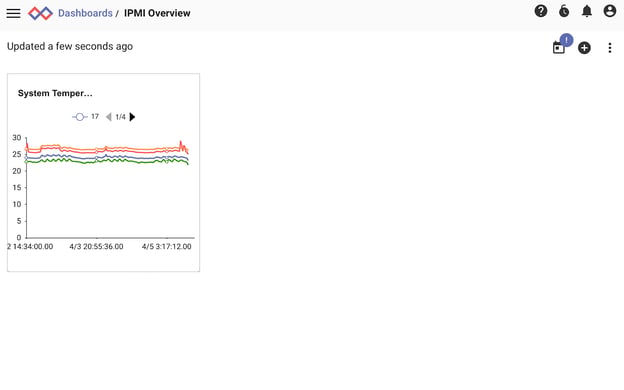
Building a query for a kit is exactly the same as just building a regular query. Let’s start by making a query that charts system temperature over time:
tag=$IPMI json Type==SDR Target Data."System Temp".Reading
| stats mean(Reading) by Target
| chart mean by Target
We have some test data in our $IPMI tag, and the chart looks like this:
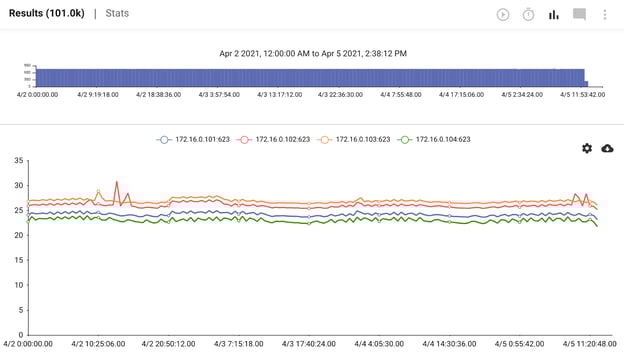
Everything here looks right, so let’s save the query by selecting the menu option in query results and clicking “Save Query”:

We’ll name the query “IPMI System Temperature by Target Over Time” and click save. We’ll also go edit the query in the Query Library menu (menu->Query Library), and add our “kit” and “ipmi” labels to the query.
And that’s all it takes! We repeat this for all the queries we’ll need for our kit. Next, dashboards!
Dashboards
As with queries, building dashboards for kits involves just building dashboards. We’ll make three dashboards for our kit: an overview that covers a handful of queries across all devices, a temperature overview that displays all temperature-related data across all devices, and a device-specific “investigation” dashboard. The investigation dashboard is identical to the overview, except that the queries are templated to be restricted to a single device selected by an actionable.
We’ll start with the overview dashboard. We already have a bunch of queries from our last step, so all we need to do here is create an empty dashboard and throw queries into tiles. To create a new dashboard, select Menu->Dashboard, then click the “Add” button.
In our empty dashboard, we can add “tiles” which contain individual queries that we can resize and move around. To get started, we’ll click the “Add Tile” button and select one of our saved queries. We’ll select the renderer we want on it and add it to the dashboard:
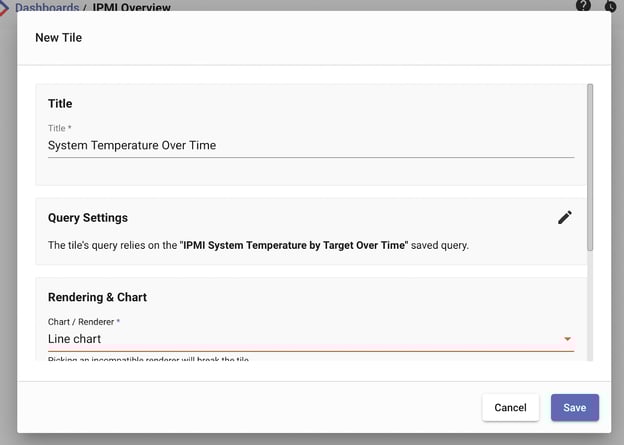
Once we add the tile to our dashboard, we end up with this lovely view:
A little spartan, but we’ll fill this up with more queries as we go. You can resize each tile by grabbing onto the bottom right corner, and move the tiles by grabbing the menu at the top of the tile.
From here it’s a bit of art over science - we just add all of our tiles and rearrange and resize until we get something that looks good.
Obligatory time-lapse:
The temperature overview is similar, just with different queries. The investigation dashboard is slightly different in that it uses templated queries. A templated query is a regular query that has one or more variables in it somewhere (in our example the variable will be named “target”). When you load a templated query, the UI will prompt for a value for the variable(s). In a dashboard that uses templates, the variable will automatically be used in any tiles that need it. Additionally, actionables can populate the variable for us when the target of the actionable is to load a dashboard (more on that in the next section), so we can get to a target-specific investigation dashboard from the overview without having to use the keyboard at all!
To create our investigation dashboard, which is similar to the overview dashboard but with target-specific queries, we’ll create templates instead of saved queries. We do this by navigating to Menu->Tools & Resources->Templates. From there we can add a template, give it a query, and specify any variables in the query by wrapping the variable with “%%” on either side of the variable name. For example, our System Temperature query from earlier would be made into a target-specific template with this query:
tag=$IPMI json Type==SDR Target=="%%target%%" Data."System Temp".Reading
| stats mean(Reading) by Target
| chart mean by Target
The only change from the original query used in the overview dashboard is that we’ve filtered our Target extraction to “%%target%%”.
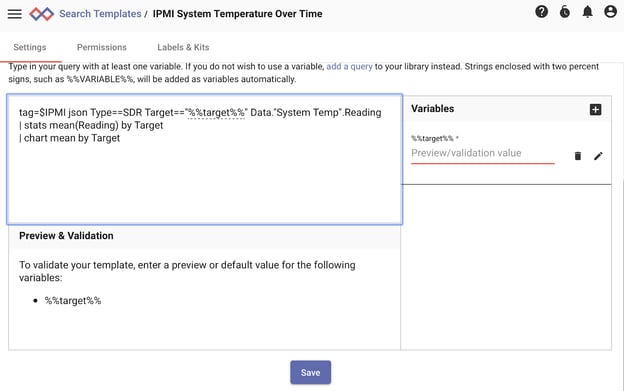
Specifying a template
Gravwell automatically adds this as a variable, and when we add this query to a dashboard, the dashboard automatically becomes a templated dashboard.

Our investigation dashboard shows that it’s templated by the (x) icon.
Actionables
In order to use our investigation dashboard effectively, we need a way to quickly jump from our overview dashboard into it without having to remember a device IP or hostname. We can do that easily by creating an actionable. We navigate to the actionables menu (Menu->Tools & Resources->Actionables), and click “Add”.
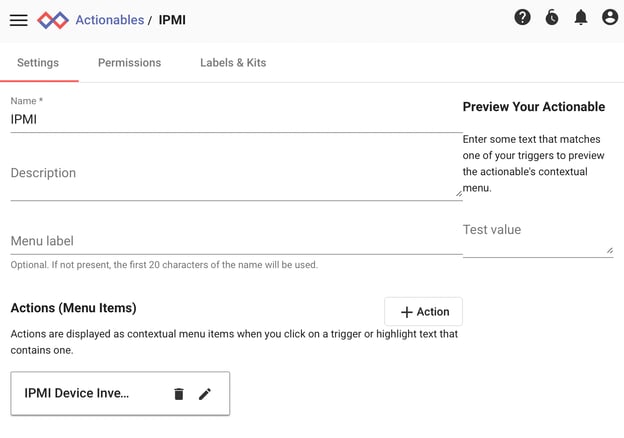
We’ll name our actionable “IPMI”. The name becomes the menu name (we’ll see it momentarily) if you don’t populate the “Menu label” field. The menu name is a grouping element, so we can add more than one actionable under the “IPMI” name, and have them nicely grouped together in the context menu.
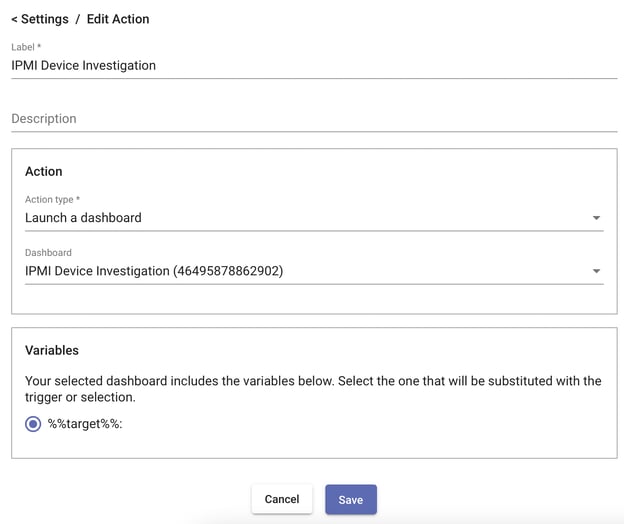
Next we’ll add an “action” to our actionable that launches our investigation dashboard. Notice that Gravwell detects that a variable is available, prompting us to choose which variable (just one in this case) the actionable should fill when it jumps to the dashboard.
Finally, we’ll specify, as a regular expression, what data should go into and trigger the actionable. It’s difficult to make a regular expression that matches on hostname (IPs are simpler, but we need to cover all cases here), so instead of having a trigger, we’ll make a simple “selection only” actionable, and specify the broadest regular expression we can “.*”.
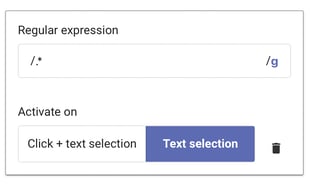
A selection-only actionable only appears when we select text in interface with the mouse:
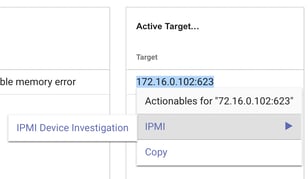
Now we can drill down into device-specific data from the overview!
And a Playbook!
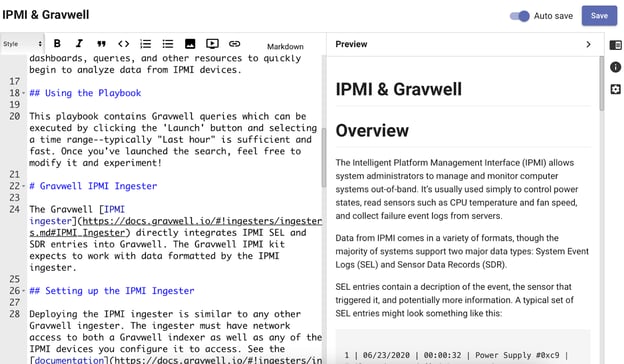
Finally, let’s add a playbook to our kit. Playbooks are simply Markdown documents that can be embedded in kits. They can contain Gravwell queries, and Gravwell automatically adds a “launch” button to queries in playbooks so you can run them directly from the document. We’ll use a playbook to introduce the kit, describe how to install and configure the IPMI ingester, and show a few examples.
We don’t go into all the detail, but again, we add our “kit” and “ipmi” labels, and write the playbook directly in Gravwell:
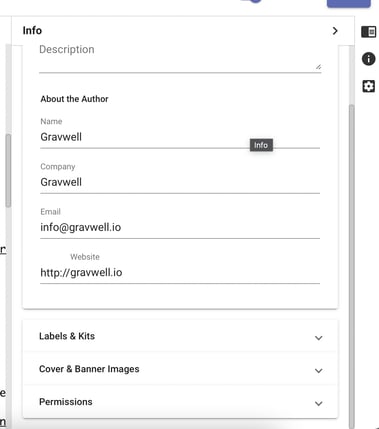
While in the playbook, you can add information such as the playbook author, labels, and even a playbook graphic by clicking on the info icon (the little “i” in a circle).
A Quick Look at Our Work
Before we export this kit, let’s take a quick look at what we’ve done.
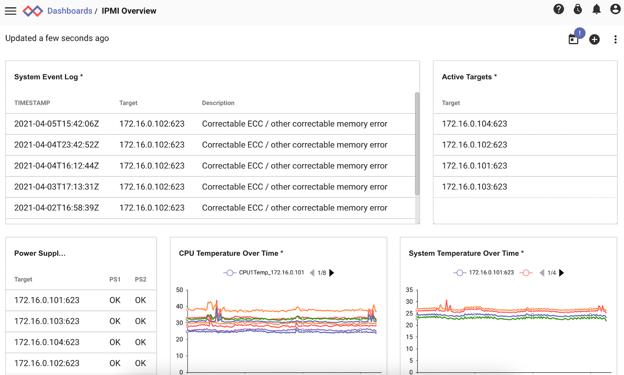
Overview
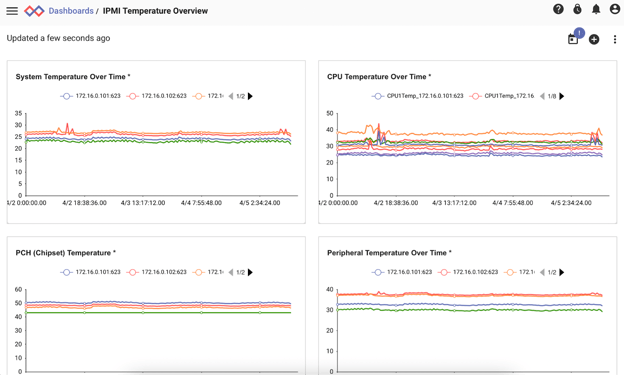
Temperature Overview
Using an actionable to investigate a single IPMI device
Not bad! Next we’ll get this kit exported!
Exporting the Kit
We now have queries, templates, a dashboard, an actionable, and a playbook ready to put into our kit. Creating a kit involves choosing which elements we’ll pack into the kit, optionally choosing a license, and providing some metadata such as version and dependencies (our kit has no dependencies, so we’ll skip that last part).
Start by navigating to the kit management menu (Menu->Tools & Resources->Kit Management) and clicking “Build” to open the kit building wizard.
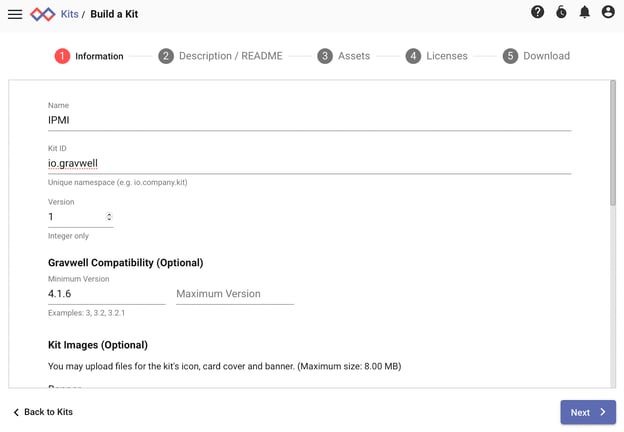
We have 5 steps - For Step 1 we’ll populate our kit name, namespace, version, etc. All official Gravwell kits have the namespace “io.gravwell.ipmi”. This is version 1, and our minimum Gravwell version allowed will be 4.1.6 - this is the first version that has the full IPMI ingester provided, so that’s why we use this as our minimum. When browsing kits, if your Gravwell version is outside of the minimum/maximum version chosen here, the kit simply won’t be displayed and will refuse to install. You can also add kit images in this step if you’d like.
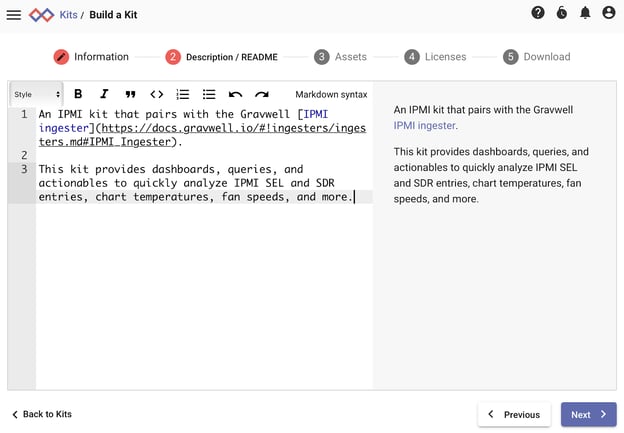
Step 2 is a simple “readme” introducing the kit and providing summary information that can be viewed before installing the kit.
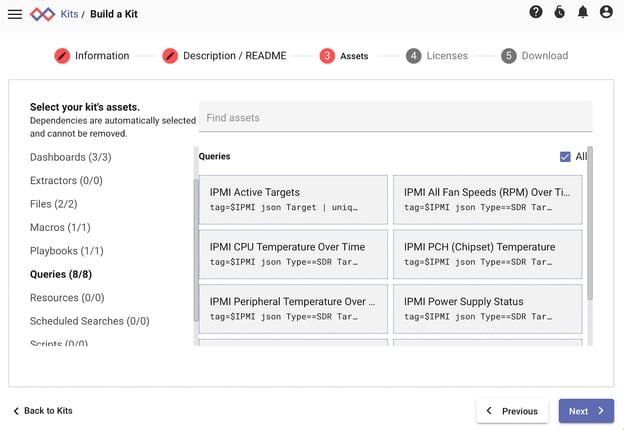
Step 3 has us choose all the assets that go into our kit. From here we select every dashboard, query, template, and so on, that we created and want packaged in the kit.
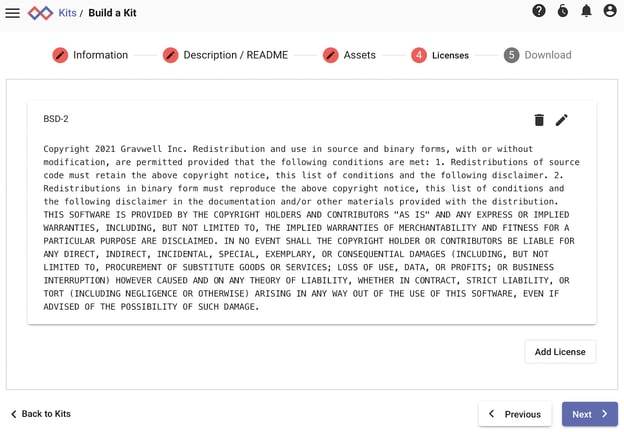
Step 4 is the license step. We’ll be open-sourcing this kit under the BSD 2-clause license, so we simply paste the BSD-2 license text into this step.
And finally step 5 - download!
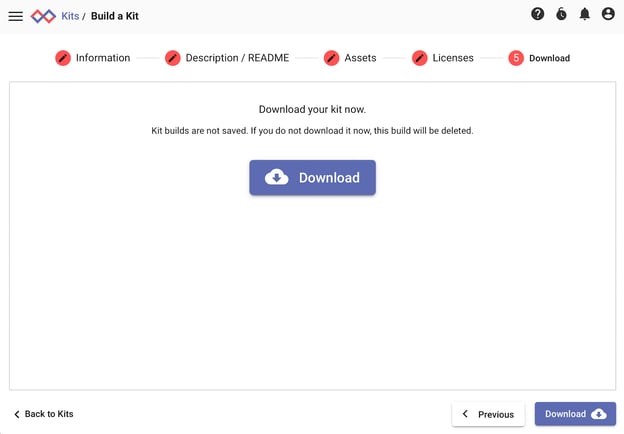
At this point we have a file named “IPMI” (or whatever you’ve named your kit). You can upload this kit into a new Gravwell instance in the Kit Management page and give it a go. While not discussed here, if you are running a kit server in your enterprise, at this point you can sign the kit and upload it for automatic distribution.
Conclusion
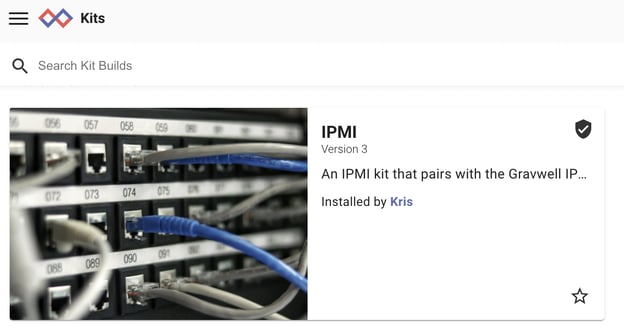
This IPMI kit is now available in the official Gravwell kit repository. Once installed, you can browse all the individual items we created such as queries and templates. Gravwell kits are as simple to create as creating a dashboard, and can make rapid deployment of pre-made analysis tools across your enterprise easy. Try it out for yourself! Request a demo of our data fusion platform at Gravwell Demo, or download the free Community Edition using the button below: