In this post we'll walk through a case study with a customer trying to identify an infrastructure capacity issue in which the system becomes unresponsive during a swell in page visits. We'll follow Alice and Bob (names changed, obviously) as they work through the issue.
The problem
Alice operates a boutique sales platform running on shared virtualization infrastructure. Alice was elated to discover that a new product had gathered significant interest and her shop experienced one of their largest volumes of visitors to date. Unfortunately, shortly after this spike started happening she saw a level-off on orders and instead the number of complaints began to rise. Alice’s visitors were unable to view the item or complete purchases!
Fearing that the website is failing, Alice contacts her hosting provider and is quickly directed to their hunt team of one, Bob. Alice and Bob are going to need Gravwell data fusion of text logs and binary network data to identify the root cause and avoid missing revenue from a swell of visitors. Bob has been using Gravwell for a few months and recently expanded his storage which enabled him to add in network data ingestion (at no extra cost).
The Gravwell Solution
Bob’s first action was to fire up Gravwell and check on the HTTP status codes being served by Alice’s website. Bob’s queries are shown here and broken down in detail later in this study. There was an increase in responses to go along with the traffic but no server errors to be seen.
tag=weblog regex "\"GET\s(?P<url>\S+)\"\s(?P<respcode>[0-9]+)" | count by respcode | chart count by respcode
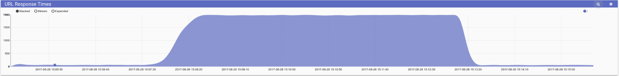
Bob’s next step was to check the response times for static pages, as well as for assets being served out of a shared content distribution network.
tag=weblog regex "\"GET\s(?P<url>\S+)\".*\s(?P<resptime>[0-9]+)ms\z" | grep -e url asset | mean resptime by url | chart mean by url
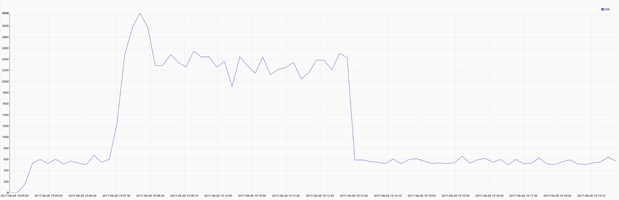
Response times for static assets are slightly above normal, but nothing that would cause any problems for customers. Bob issues another query for for the web application API and finds a more dramatic increase in response times, but nothing that should cause the requests to outright fail.
tag=weblog regex "\"GET\s(?P<url>\S+)\".*\s(?P<resptime>[0-9]+)ms\z" | grep -e url api | mean resptime by url over 3s | chart mean by url
Another investigator armed with any other tool might stop here, reporting to his customer that even though the infrastructure is heavily loaded, everything is fine. However, Bob isn’t a typical technician armed with typical tools. Bob has Gravwell. Bob’s next salvo was a query that goes deep below the typical application and proxy logs, down into the network where other tools cannot go.
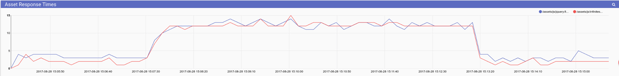
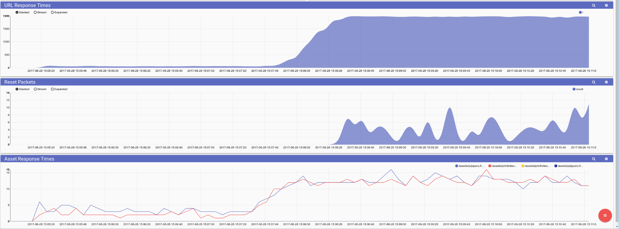
Bob needed to identify if the underlying infrastructure is rejecting connections before the applications even get a chance to see them. He began to look at rejections at the lowest level -- TCP reset packets. Bob knew that reset packets are normal in day to day operations so he narrowed down further, looking only for reset packets which originate from Alice’s web application. Bob creates a new dashboard with API response times, TCP Reset frequency, and static asset response times so he can correlate them all in a single view.
tag=webpcap packet tcp.DstPort==8080 tcp.RST==1 | count | chart count
The correlated view made it clear, as Alice brought in a large influx of new visitors the underlying virtual infrastructure was buckling under the load and failing to get connections to Alice’s web application. Gravwell provided visibility at all levels of the application stack in a single place, allowing Bob to quickly and efficiently identify the root cause of the problem. Bob quickly made some changes to the load balancer and Alice enjoyed her most profitable quarter yet.
Detailed Query Breakdown
Let’s breakdown the search queries into parts and talk about why each part is used.
The initial investigation queries
First we’ll dig into Bob’s rapid fire log analysis queries.
tag=weblog regex "\"GET\s(?P<url>\S+)\"\s(?P<respcode>[0-9]+)" | count by respcode | chart count by respcode
|
Query Module |
Purpose |
|
tag=weblog |
Bob puts all web log traffic into a separate Well. This improves performance because other data records (e.g. network data) are not read for analysis. Gravwell best practices use tags as the first “filter” against different data types. |
|
regex "\"GET\s(?P<url>\S+) \"\s(?P<respcode>[0-9]+)" |
This application uses a non-standard logging format for internal DevOps so Bob usually uses the regular expression search module to pull out enumerated values from the raw underlying log. A core tenant of Gravwell is “you don’t know what you don’t know.” Gravwell contains multiple low level search modules that allow you to extract intelligence from any binary or text stream for analysis. Gravwell also provides standard modules for analyzing logs that follow well-known formats such as Apache style web logs. |
|
count by respcode |
The count module is invoked to condense all entries by their response code. Any modules in the pipeline after this will receive this condensed data. |
|
chart count by respcode |
The chart module is passed our condensed count values for display as a chart. |
tag=weblog regex "\"GET\s(?P<url>\S+)\".*\s(?P<resptime>[0-9]+)ms\z" | grep -e url asset | mean resptime by url | chart mean by url
|
Query Module |
Purpose |
|
tag=weblog regex "\"GET\s(?P<url>\S+)\".*\s (?P<resptime>[0-9]+)ms\z" |
The first part of the query is similar to the previous. We’re looking under a specific tag and using regex to pull out values from the raw entry in the pipeline. |
|
grep -e url asset |
Here Bob invokes the grep module with the -e option which means it’s going to look in the url value for the string “asset” |
|
mean resptime by url |
This time Bob used the ‘mean’ module to condense the average response times. Any modules in the pipeline after this will receive this condensed data. |
|
chart mean by url |
The chart module is passed our condensed average values for display as a chart. |
tag=weblog regex "\"GET\s(?P<url>\S+)\".*\s(?P<resptime>[0-9]+)ms\z" | grep -e url api | mean resptime by url over 3s | chart mean by url
|
Query Module |
Purpose |
|
tag=weblog regex "\"GET\s(?P<url>\S+)\".*\s(?P<resptime>[0-9]+)ms\z" | grep -e url api | mean resptime by url over 3s | chart mean by url |
This query is very similar to the previous one. Bob changed the grep to look for only urls belonging to the api and added a specific averaging window of three seconds to the “mean” condensing module. This way he’s looking at the average over a sliding 3-second period. |
These three queries provide a pretty good view into what the web application is seeing.
Data fusion of DevOps text and PCAP binary
The web application logs didn’t indicate any sort of problem which likely means the issue lies elsewhere in the infrastructure. Bob went to add on some network traffic searches to correlate with the text logs:
tag=webpcap packet tcp.DstPort==8080 tcp.RST==1 | count | chart count
|
Query Module |
Purpose |
|
tag=webpcap |
Bob puts network traffic into a separate well so as to avoid searching it for every query. Here he invokes the tag filter to direct the search at that data specifically. |
|
Packet tcp.SrcPort == 8080 tcp.RST == 1 |
Here Bob uses the packet module to pull out the TCP/IP values from a packet. Bob could use the low-level binary access methods and manually carve out those values but Gravwell provides an easy search module for common network protocols. Bob extracts the destination port and TCP Reset Flag and then filters based on the web application port of 8080 and having the reset flag present. These two factors indicate a visitor attempting to reach the web application but the server is shutting down the connection. |
|
count | chart count |
Here we are counting the number of entries (and in this case one entry is the same as one packet) and then charting that count. |
Final Thoughts
It’s not always possible to have the logs we desire. We often lack the foresight or simply do not have the power to create log entries to cover every aspect of a system. This problem is why we created Gravwell to conduct data fusion from any data source. By ingesting network data and correlating with the DevOps logs, this customer was able to identify the root issue and improve their infrastructure which allowed them to satisfy their customers and capture revenue.
Try Gravwell Yourself
If you are interested in seeing the power that Gravwell can provide for your hunt teams, contact us at info@gravwell.io for more information or request a trial using the button below.