Gravwell 4.1 introduces a new module - Enrich - that can add static data to every entry in a query. Sometimes you need to add static data to a dataset, such as the standard deviation itself across all entries in the dataset or annotations about the query, or you may want to fuse several data points from a resource. The enrich module provides this simple but important feature.
The Enrich module, new in Gravwell's 4.1.0 release, is a powerful tool that allows users to add static data to entries, enable data fusion, and pivot on properties of the dataset.

Let’s start with a simple example - adding a column “Tool” containing the value "Gravwell" to every entry in a query - that way everyone will know where this query came from and wonder why they aren’t using Gravwell in their enterprise. Before Gravwell 4.1, we could accomplish this with the eval module:
tag=dns json Question.Hdr.Name
| eval setEnum(“Tool”, “Gravwell”)
| table Name Tool
While this works, it can become cumbersome when adding several columns, and it isn’t as performant as the enrich module.
Let’s rewrite this query with the enrich module:
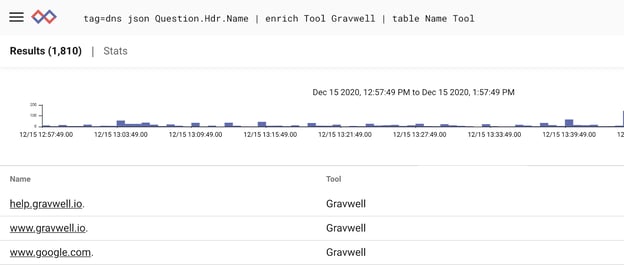
tag=dns json Question.Hdr.Name
| enrich Tool Gravwell
| table Name Tool
The above query simply uses the enrich module to add the string “Gravwell” to the column “Tool” in every entry:
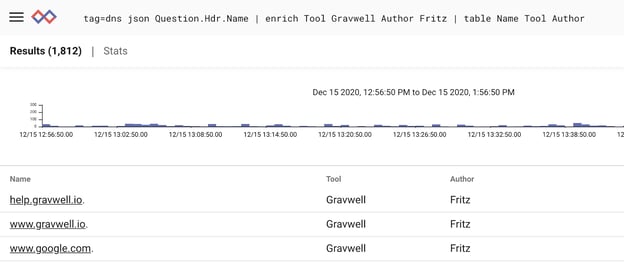
We can add more than one column by adding more pairs of fields. Let’s add our author’s name to the query:
Using Enrich with Resources
Enrich can extract columns from resources as well. Let’s add a CSV-based resource named “contact_info” with the following contents:
Name,Company,Email
fritz,Gravwell,support@gravwell.io
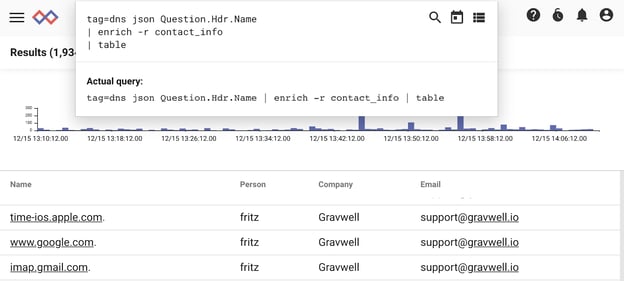
Simple enough - we have a single row CSV with 3 columns. Let’s ask enrich to add all of these columns to our query:
tag=dns json Question.Hdr.Name
| enrich -r contact_info
| table
All set. Next let’s look at a real example.
Simplifying Anomaly Detection with Enrich
Gravwell runs queries by streaming data through modules in a pipeline. This is great when you have queries that operate on large datasets: processing 100 billion entries is no problem because we don’t have to buffer data anywhere with streaming. But what if you want to run a query against some property of the dataset itself? A classic example is anomaly detection by taking the mean and standard deviation of the data and looking for values that are outside some boundary. While simple, this requires knowing something about the entire dataset (the mean and standard deviation) before filtering out values that aren’t above our boundary. With a streaming query system, we would need to buffer all of our data, calculate some value, and then walk the data a second time to filter. With large queries, say the last 5 years of HTTP connections to our webserver, we could easily run out of memory, making this operation impossible. With enrich, and help from another new feature in Gravwell 4.1, compound queries, we can simplify this operation without having to buffer large datasets.
Note: If you haven’t already, take a look at our blog post on Compound Queries.
Let’s begin with a simple dataset of numbers, which we can plot over time with:
tag=numbers ax chart val
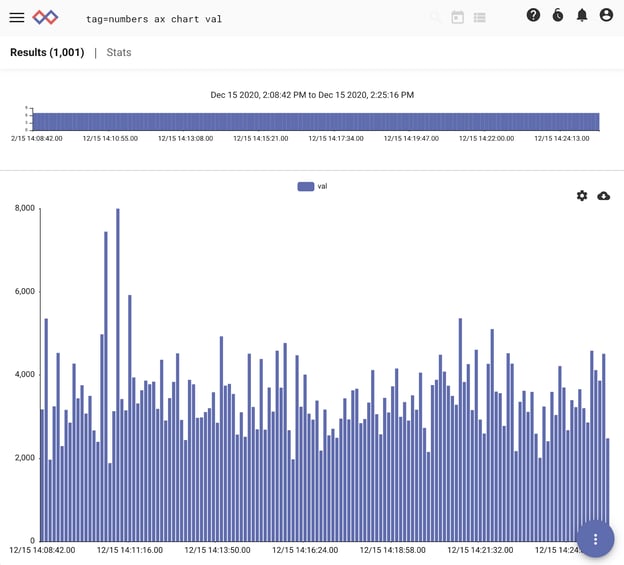
We can see already that a few values in our time series of data stand out early in our dataset. We can filter out the normal data to expose outliers, and use the output to trigger alerts and simplify threat hunting. Let’s combine compound queries with enrich to calculate the mean and standard deviation of the entire dataset and filter out entries that are below a threshold. We’ll use twice the standard deviation of the mean as our threshold.
@stats{
tag=numbers ax
| stats mean(val) stddev(val)
};
tag=numbers ax
| enrich -r @stats
| eval val > (mean + 2*stddev)
| chart val
Let’s walk through each part of this query. In the subquery, we grab our dataset and calculate the mean and standard deviation. The output is 2 values - “mean” and “stddev”. In compound queries, these values are saved in the temporary resource “@stats”.
In the main query, we again grab our dataset, and use enrich to add the mean and standard deviation calculated in the subquery to every entry. From there we use eval to filter out values that aren’t above our threshold. Let’s chart this query:
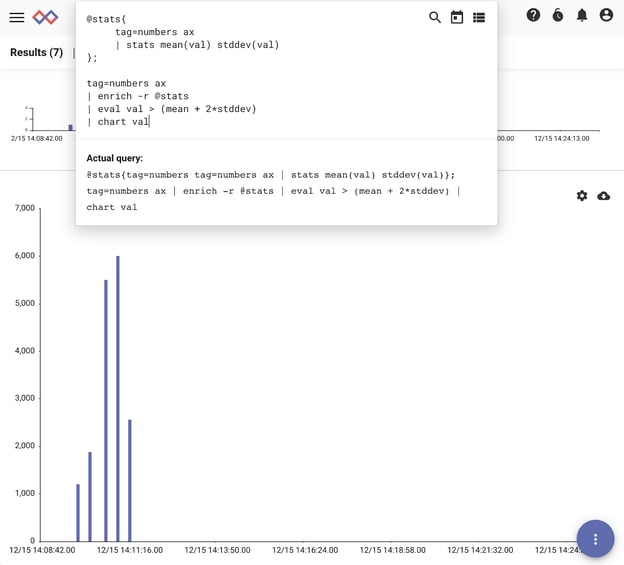
And sure enough we have several values that stand out among the noise. Try applying this to connection logs and DNS records - you might find something new!
The Takeaway
The enrich module is a simple but powerful tool to add static data to entries, enabling data fusion, pivoting on properties of the dataset itself, and more. For more information or to see Gravwell in action, request a walk-through using the button below.