This week sees the release of Gravwell 3.3.9, our last planned release prior to the 3.4.0 "Big Bang" release. The Big Bang release will introduce Gravwell kits (our way of providing pre-packaged dashboards, resources, SOAR scripts, and more) plus lots of new user interface features. But first, let's talk about 3.3.0. This relatively boring release is mostly comprised of bug fixes, a new timegrinder timestamp, and one UI tweak. Full change log available here.
Bug Fixes
The bug fixes are mostly around some edge cases in the stats modules and some sanity checking in our SOAR engine that ended up being a little too conservative. We found and fixed some issues in the stats module that were causing the min and max operators to not handle native timestamp types correctly. This made queries that were looking for minimum and maximum timestamps based on some grouping key misbehave (e.g. tag=foo json username | stats max(TIMESTAMP) by username).
We also found an interesting bug where queries that used complex stats operations and were then displayed in a table would fail to properly reload after being saved. Basically, if you ran a query that performed multiple stats operations, fed it to the table renderer, then saved the query, when you reattached to the query the table renderer would kick into an improper rendering mode. Luckily this was an easy fix and any previously saved queries render properly now, so no data was lost.
Our SOAR system is Turing Complete, which means it's pretty easy to shoot yourself in the foot. As a result we implemented some safety systems to act as bumpers, so while we cannot solve the Halting Problem we can at least make sure that SOAR scripts are "doing something" by checking their progress and ensuring that they are making regular calls into some external interface. Basically, we are trying to catch poorly formed loops that cause the script to run forever without accomplishing anything. Unfortunately we found a bug that caused this system to incorrectly terminate the script when very long-running queries were invoked in a SOAR script; this has now been fixed.
New Timegrinder Format
Timestamps are a gigantic mess. There are literally hundreds of them, and different continents don't agree on whether the day comes first or the month. (Let me take this opportunity to concede that Year-Day-Month order is insanity, but that's beside the point.) As of 3.3.9 we now support the LDAP time format (sometimes called "Windows NT time format" or FILETIME or NTFS time). LDAP time is one of those time formats that REALLY makes you wonder what led someone to decide "this is how this will be done."
LDAP time is a 64bit integer that represents the number of 100ns time slices since Janurary 1st 1601. A rational human being might ask some questions, like "why 1601" and "why 100ns?" These are all legitimate questions to which I am unable to find any answers other than "BECAUSE WE SAID SO!" Anyway, we support this timestamp format now.
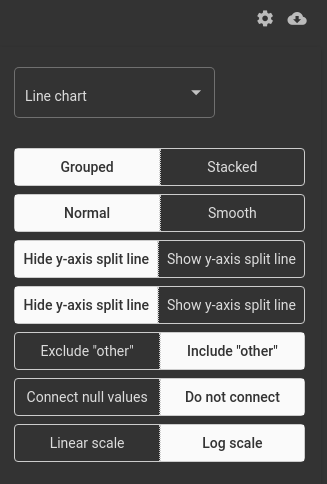
Charts With Logarithmic Scales
Nothing terribly fancy here: the charting render can now show graphs with a logarithmic Y axis instead of a linear Y access. This scale can be useful when looking at data with exponential growth, like say... a certain something that shall-not-be-named which is making 2020 really suck.
To change a chart from linear to logarithmic mode, click the gear icon and select Log scale.
The chart will go from looking like this:
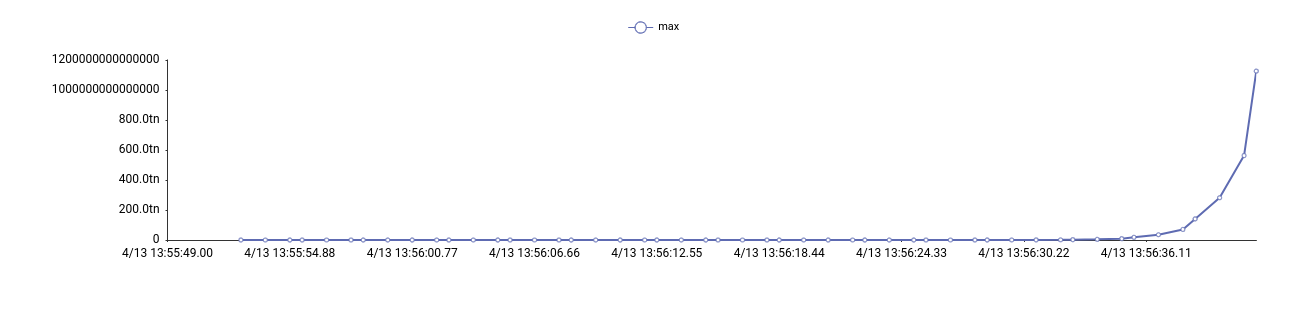
To something like this:
.png?width=1308&name=chart-search-8128266687%20(1).png)
Changes to Metrics and Crash Reporting
Gravwell installers contain an embedded crash reporting service that we use to ensure that we can identify and correct problems as quickly as possible. The crash reporting system looks for faults in Gravwell components and ships stack trace whenever a component goes down in an abnormal way. We are VERY cognizant of user privacy and we will NEVER ship user data; this is literally just a trace of where various threads were when the system decided to die.
Transparency is important to us and a user was surprised when we caught a pretty esoteric bug and fixed it before they were able to report it to us. As a result of that interaction we found that we hadn't made it clear enough in our quickstart guide what the crash reporting and metrics system was doing and how to disable it should you choose. We have added a new section to our documentation and linked it to the quickstart guide and our dockerhub pages to ensure that anyone using Gravwell has easy access to understand that system.
We built it so that we can react to bugs and fix them quickly and it is an important piece of our support infrastructure, however if users still don't trust us or don't want to participate we want to make sure it's clear how to disable that system. The documentation page on the Crash Reporting and Metrics system, along with examples and instructions on how to disable each, is available on our wiki.
Closing It Out
We are very excited to show the world Gravwell 3.4 with many new features that will help streamline deployments and provide significant out-of-the-box functionality without compromising data availability. While Gravwell 3.3.9 isn't as exciting, it's important to keep ticking along and making the product better every week, even if the new stuff is just fixes.
If you would like to try Gravwell and begin searching all of your data in all its forms, sign up for a free Gravwell Trial by clicking the button below:
 .
.