Maybe you've just signed up for Gravwell Community Edition and are not quite sure where to start. There are a lot of features in Gravwell, and a lot of different ingesters for pulling in data. Gravwell 4.0 includes a kit that can collect data without any external ingester--and it helps you analyze everyone's favorite topic, the weather!
Gravwell 4.0 introduced kits, which are pre-built bundles of dashboards, search queries, resources, and more. We've got kits for Netflow, DNS, and other "serious" data types, but we also built a little kit to gather weather conditions and show a pretty dashboard. It doesn't need an ingester to gather weather data; instead, it runs a script every minute which polls OpenWeatherMap (https://openweathermap.org) for current weather conditions at a list of locations you provide.
In this post, we'll show how to install the weather kit and how you can use it as a starting point for learning Gravwell's query language.
Getting Ready
Before you can install the kit, you'll obviously need to be on Gravwell 4.0. Head over to the quickstart page (https://docs.gravwell.io/docs/#!quickstart/quickstart.md) if you don't already have Gravwell.
You'll also need an OpenWeatherMap API key to fetch weather data. The instructions to get an API key can be found at https://openweathermap.org/appid. You'll end up with a long string of characters which will be pasted into Gravwell during the kit installation process. Note that it may take an hour or two before your key is activated.
Installing the Kit
You can find the kit by clicking the "Kits" item in the main menu. If there are no kits already installed, the GUI will automatically show you a list of *available* kits:
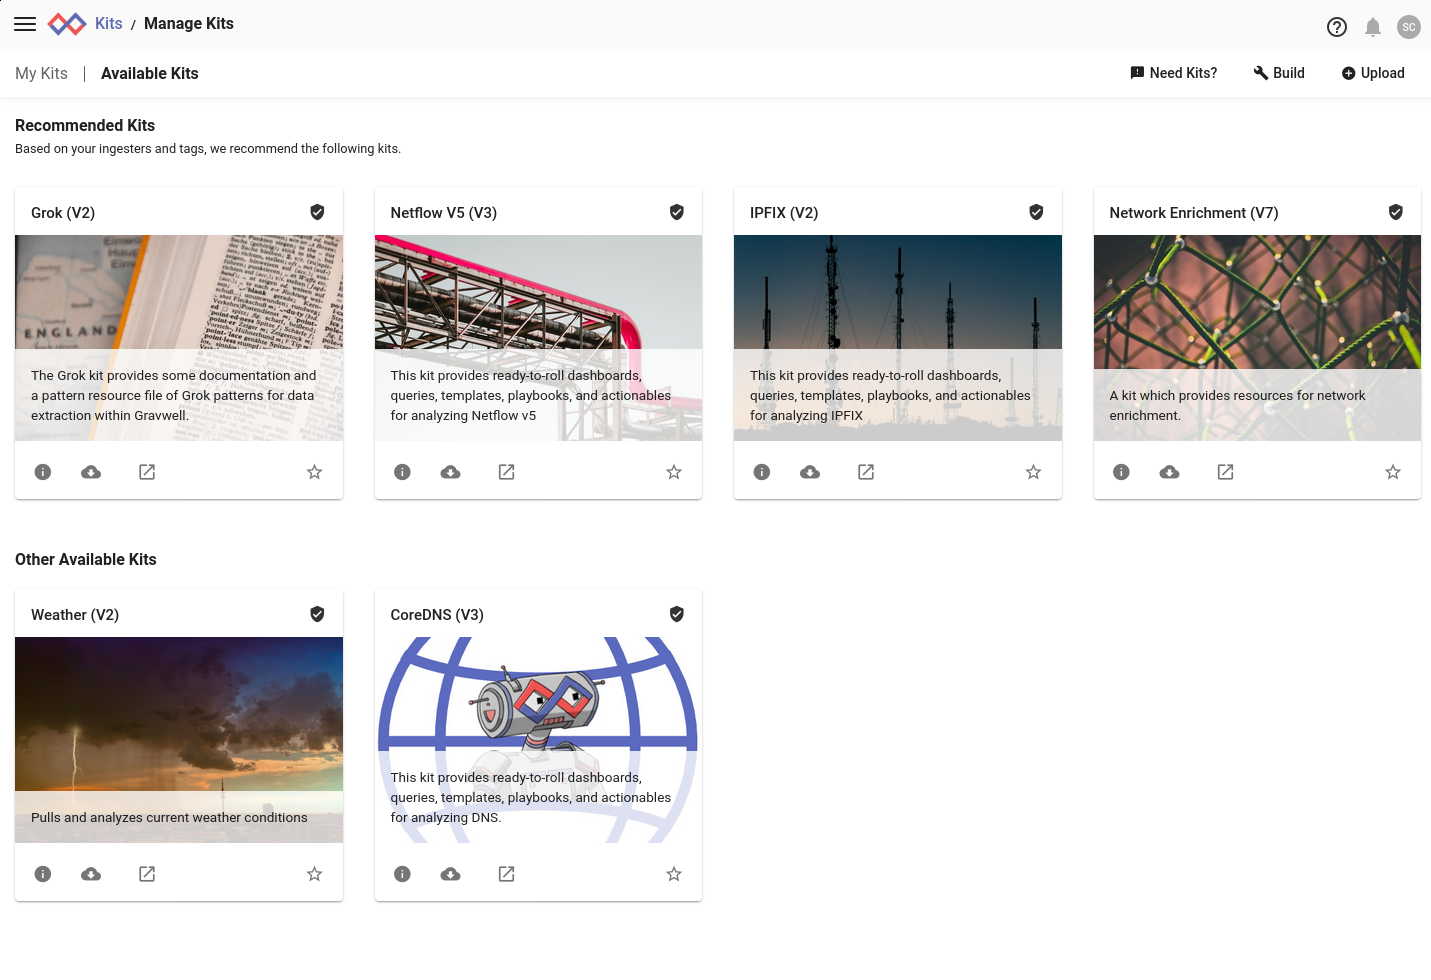
We want to install the Weather kit, so click the deploy icon (an arrow pointing out of a box) on the Weather kit's tile. This will bring up the installation wizard. The first page lists the items included in the kit and provides an opportunity to review the contents; select the checkbox at the bottom, then hit Next:

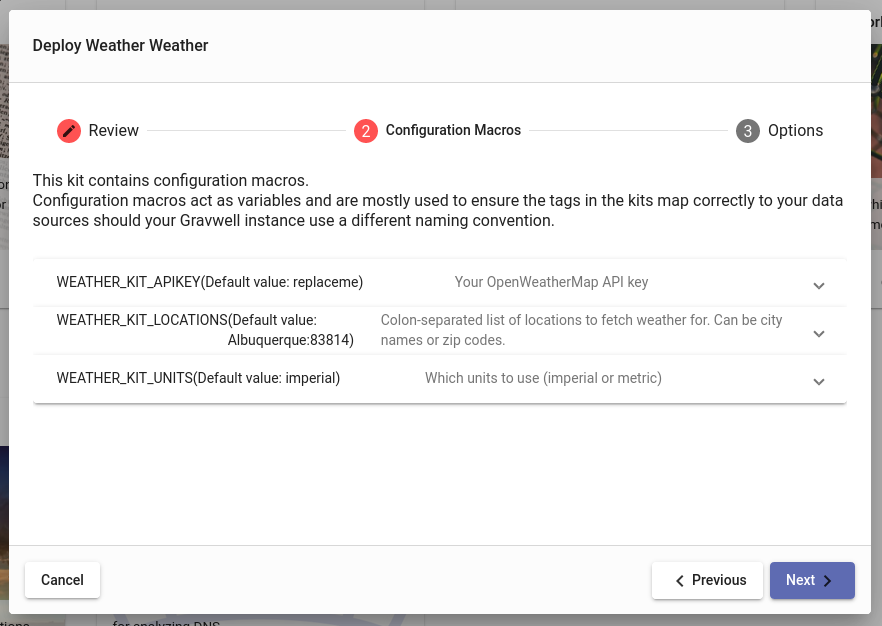
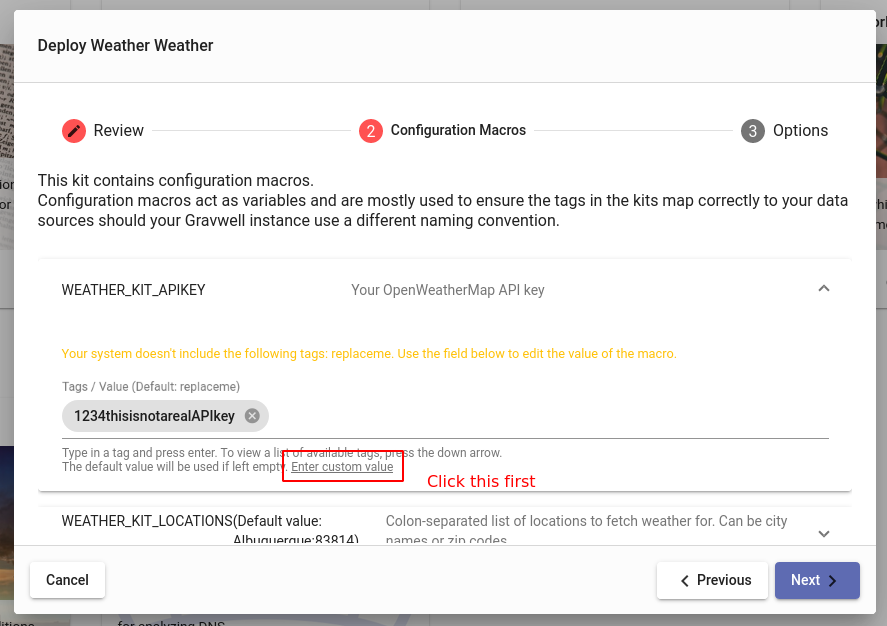
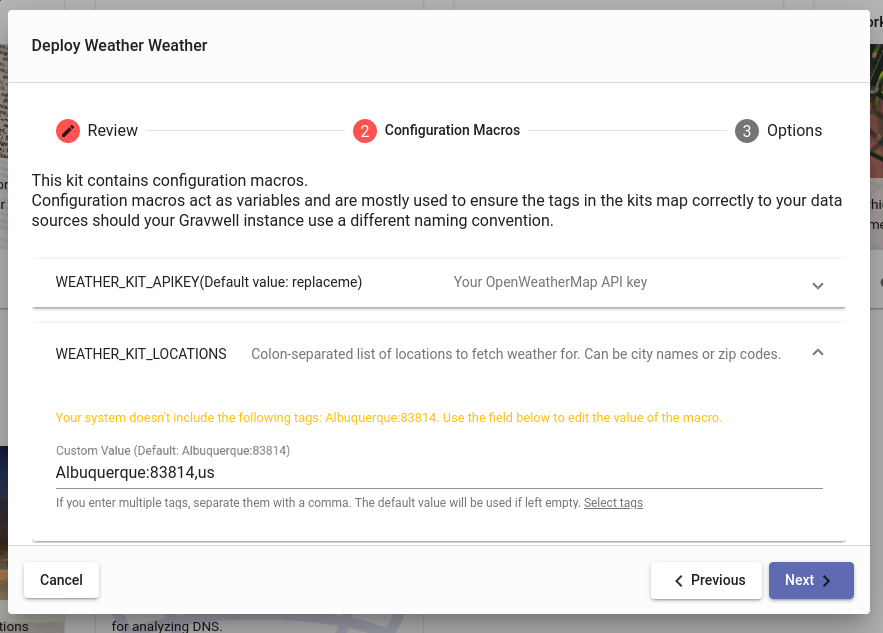
The second page contains Configuration Macros. These are used to configure the kit. You'll need to enter your OpenWeatherMap API key in the first macro, then set a list of locations to monitor in the second. The third macro controls the units used and can be left at the default ("imperial") or changed to "metric". When entering values in the configuration macro fields, first click the "Enter custom value" link to turn off certain validation rules.
Note: The list of locations should consist of a colon-separated list of locations as described at https://openweathermap.org/current#one. Be aware that multiple countries use the same ZIP code format as the US, so specifying "87110,us" is usually better than just "87110".
When you are done setting up Config Macros, click "Next" for the final page of the wizard. This gives a few final options relating to the kit installation; you can simply click "Deploy":

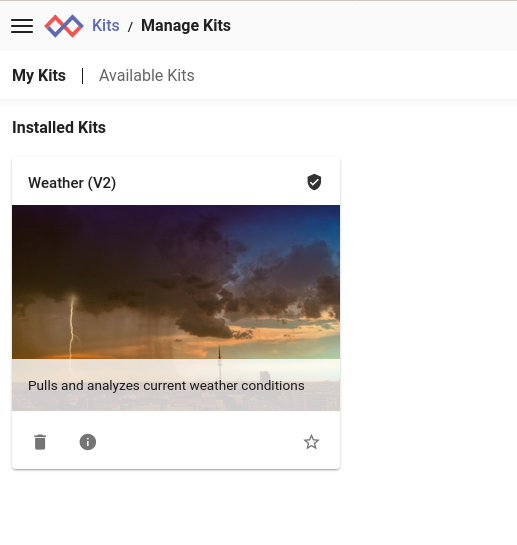
Once the kit is installed, you will be taken to a list of installed kits, which should show the newly-installed Weather kit:
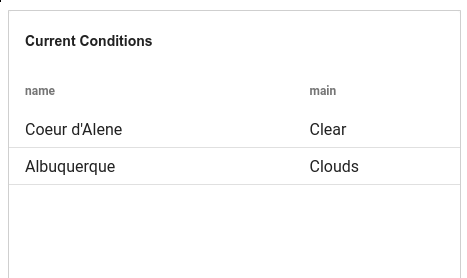
The script included in the kit should soon begin pulling in weather data. After a minute or two, we should have some data to work with, so click the main menu, open the "Dashboards" page, and click the "Weather Overview" dashboard. There won't be much to see on the temperature charts yet, but you should at least be able to look at the "Current Conditions" table in the lower left:
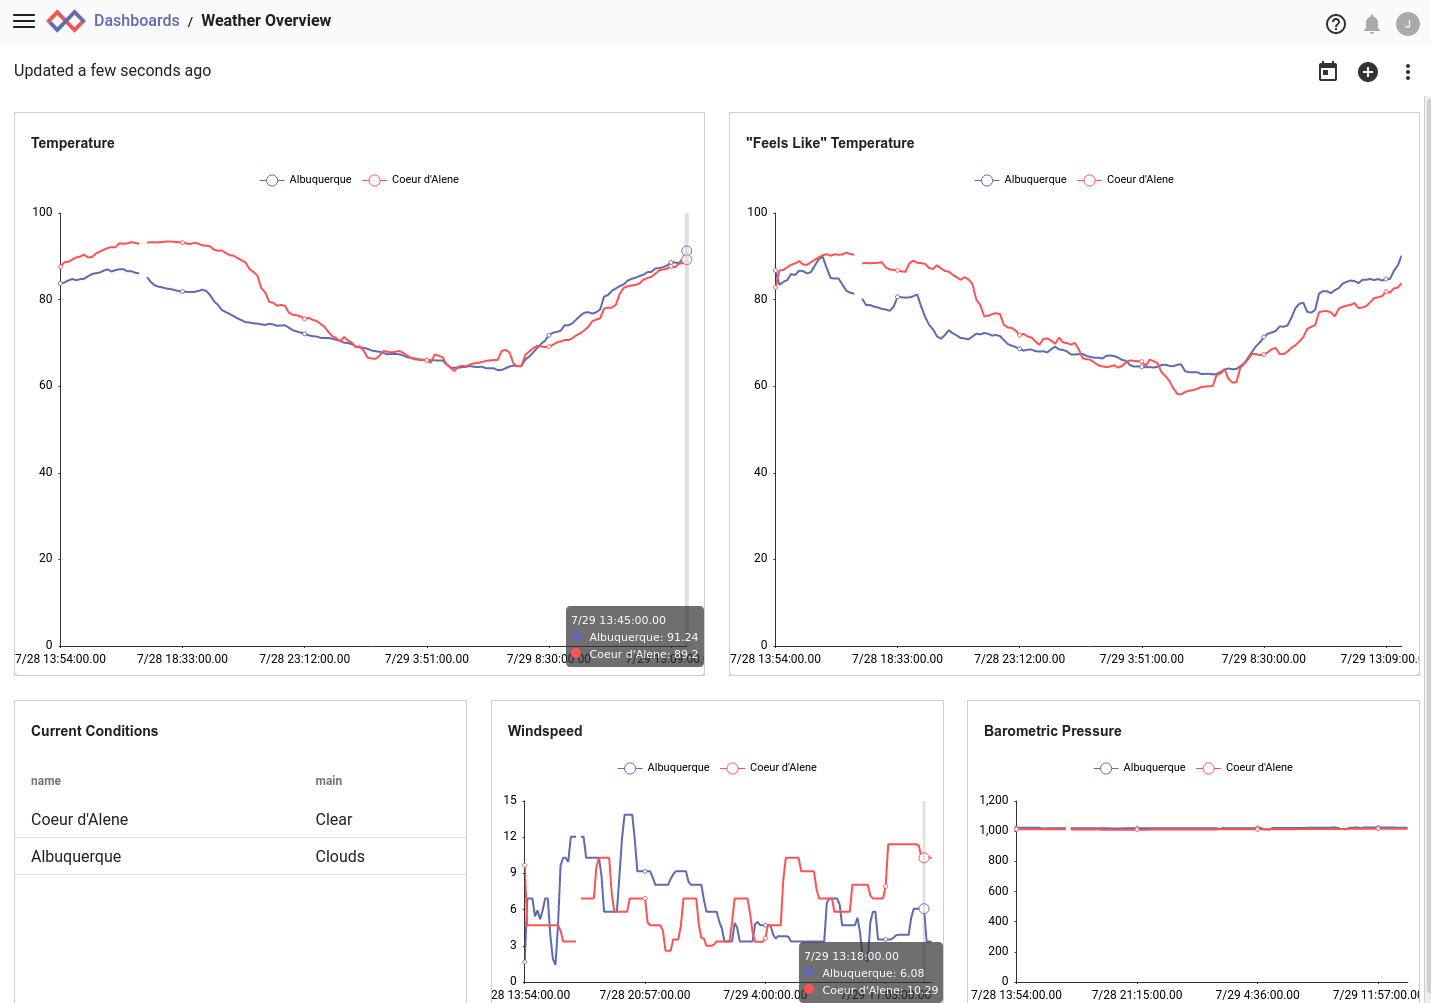
After a day or so, you'll have gathered enough data to see nice charts like this:

Delving Deeper
The dashboard in the Weather kit is a good way to start poking around with Gravwell's query language. If you mouse over any of the tiles in the dashboard, you'll see a magnifying glass icon; clicking this brings up a menu that will let you select a timeframe and run the query from that tile:

If we select "Last 24 hours", we'll see the same chart as we saw in the dashboard, but we'll also have access to the query for experimentation:
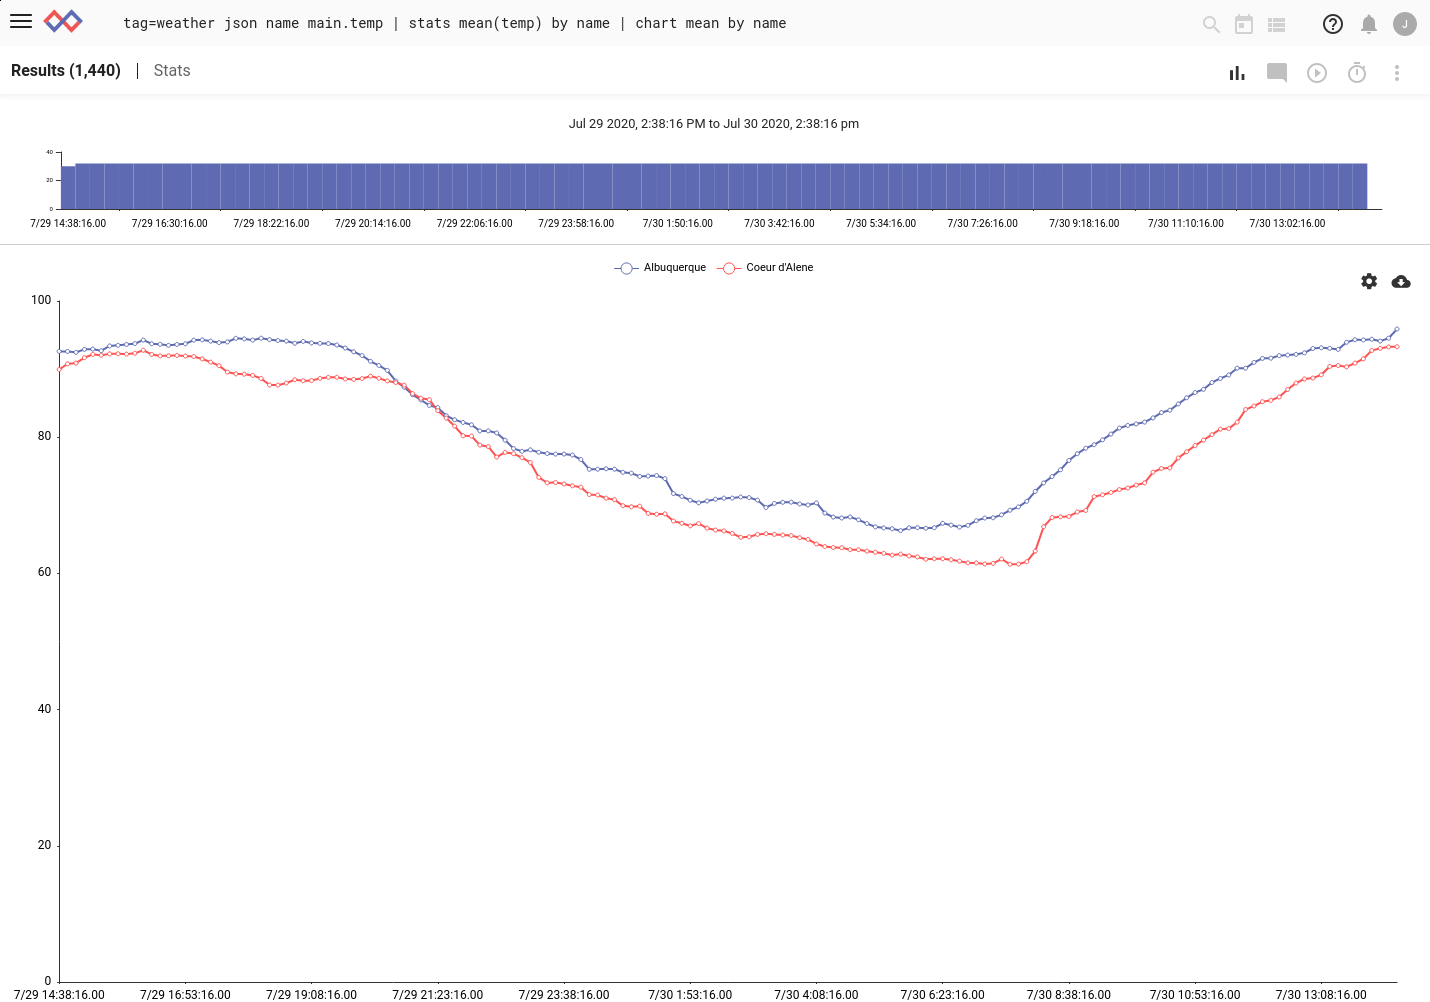
We can see that the query takes the raw data (tag=weather), uses the JSON module to extract the city name and temperature (json name main.temp), then calculates the mean temperature for each city (stats mean(temp) by name) and finally charts the mean for each city. We calculate the mean because of how Gravwell "condenses" data--it needs to know how to represent multiple temperature readings as a single point on the graph, so we calculate the mean in order to "hint" that.
If we strip away everything except the basics (tag=weather) we can see the raw data:

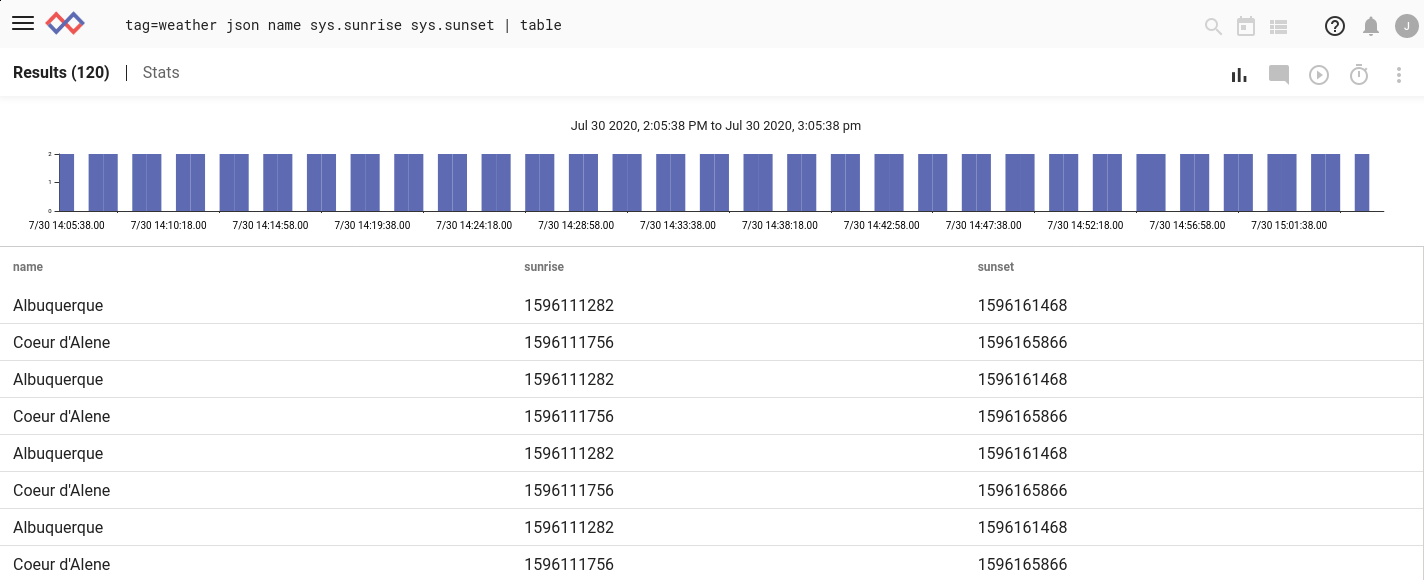
In the screenshot, you'll note that we have separate entries for Albuquerque and Coeur d'Alene, one entry per city per minute. We can browse the JSON and see if there's anything else interesting in there. Looking a bit more, we can see that there's a "sys" structure which contains "sunrise" and "sunset" fields, apparently in Unix timestamp format. This seems interesting! Let's extract those timestamps with the simple query tag=weather json name sys.sunrise sys.sunset | table
We can use the time module to parse these numbers as timestamps:
tag=weather json name sys.sunrise sys.sunset | time sunrise parsedRise sunset parsedSet | table

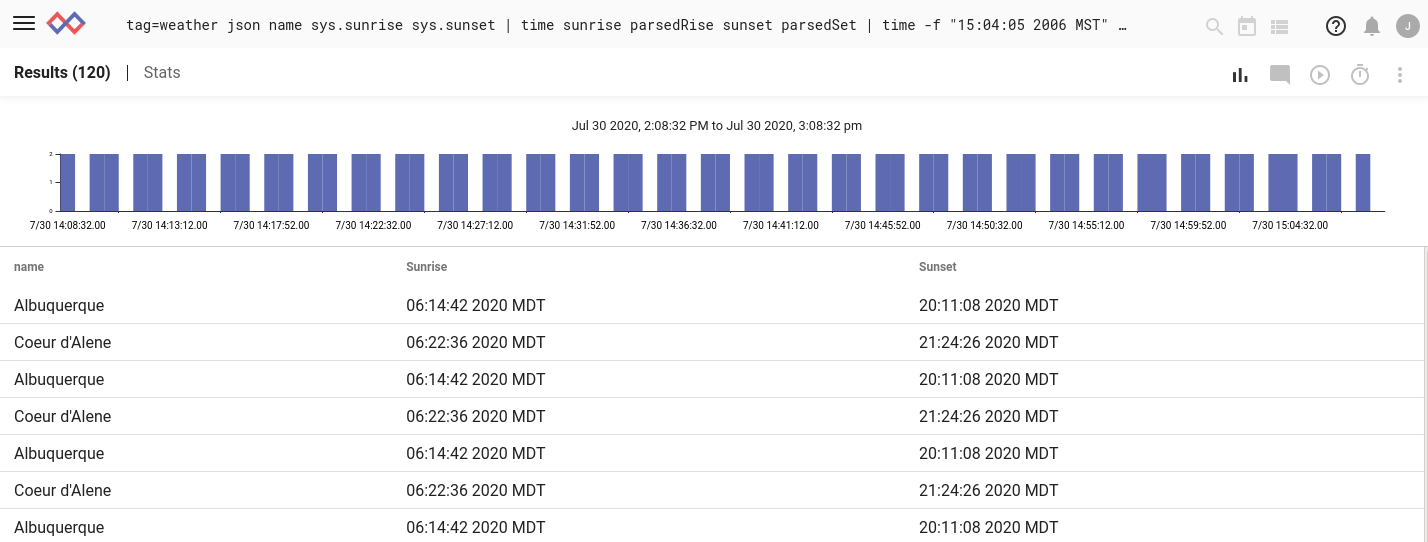
Unfortunately the times are being displayed in the UTC timezone, which isn't very convenient for us in the USA. Luckily, we can use the `time` module again, this time to format the parsed times as strings in a particular timezone:
tag=weather json name sys.sunrise sys.sunset | time sunrise parsedRise sunset parsedSet | time -f "15:04:05 2006 MST" -tz "America/Denver" parsedRise Sunrise parsedSet Sunset | table name Sunrise Sunset
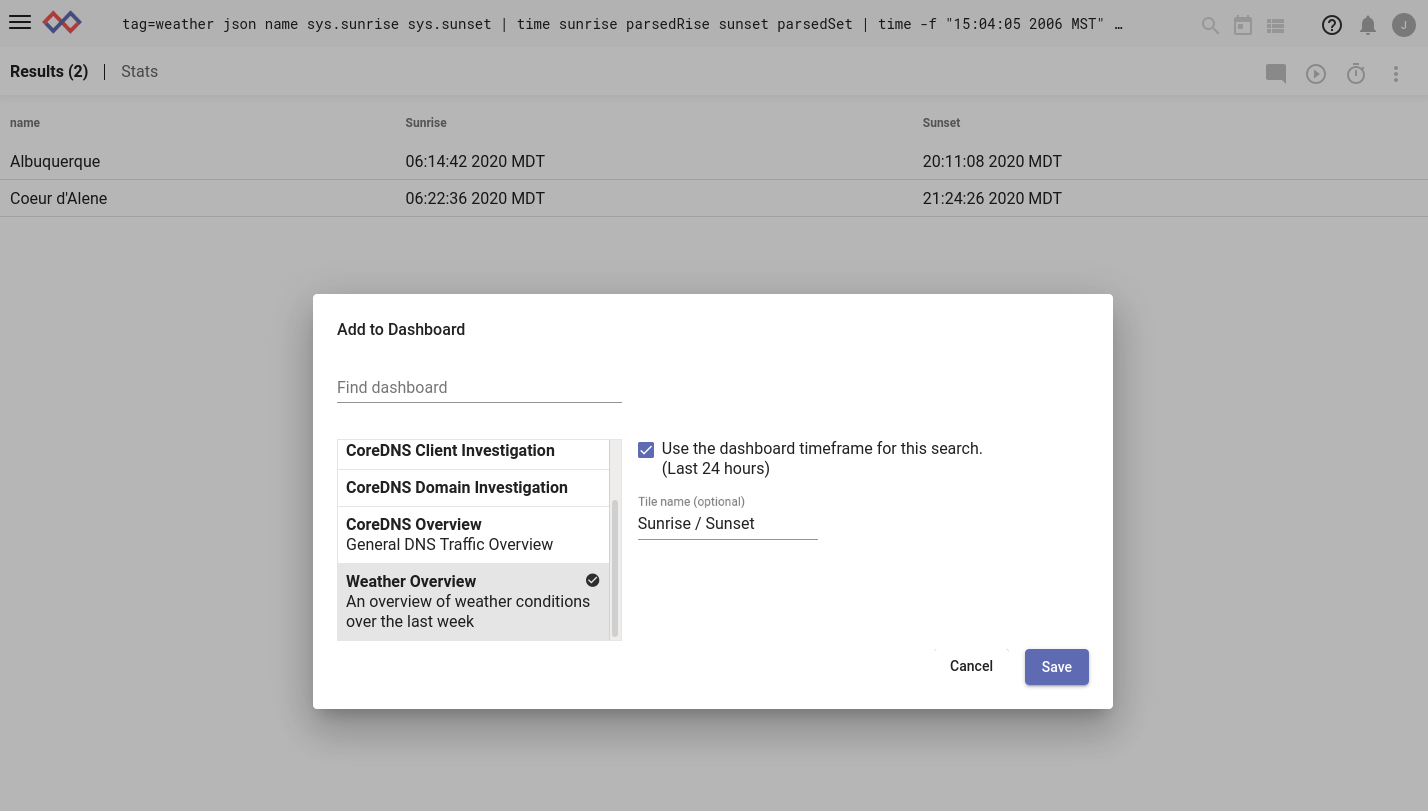
Finally, we can get rid of all the duplicate entries using the `unique` module, then add the results to our weather dashboard:
tag=weather json name sys.sunrise sys.sunset | time sunrise parsedRise sunset parsedSet | time -f "15:04:05 2006 MST" -tz "America/Denver" parsedRise Sunrise parsedSet Sunset | unique name | table -nt name Sunrise Sunset

Conclusion
The Weather kit is a fun and easy way to start playing with Gravwell, using a data source most of us know something about: the weather. We've seen how to install the kit, and how you can use the queries in the pre-built dashboard as a jumping-off point to build your own weather queries--and add those queries to the dashboard! If you need help getting started with kits, drop us a line at support@gravwell.io or: