Zeek can give you so much insight into what's going on in your network, but it can feel like drinking from the firehose - dozens of files full of terse log entries, and no easy way to cross-reference or merge them. That's where Gravwell's new Zeek kit comes in. It's a suite of pre-built queries, dashboards, and more which can help you make sense of what Zeek's telling you with a few clicks.
Zeek, formerly Bro, is a popular tool that can do semantic analysis on network traffic, detecting protocols and extracting as much information as possible. The result is a collection of files containing single-line records for different protocols. A single connection might result in several logs: for instance, opening a web page via HTTPS will create entries in the "conn", "ssl", and "x509" logs. You could read through these files by hand, grepping for IP addresses, ports, and hostnames, but it's awkward. The Gravwell Zeek kit makes these log entries much more tractable.
You can also watch a walkthrough showing the features of the new Zeek kit in this video:
Digression: The Gravwell/Zeek Docker Container
Before you can really use the Zeek kit, you need to get Zeek data into Gravwell. We've gone ahead and made the process a little easier by shipping a Docker container with Zeek and our File Follower ingester pre-configured: all you need to do is point it at your Gravwell indexer and a network interface and let it go. Don't have an instance of Gravwell yet? Grab a free trial, or schedule a demo with one of our Gravwell Guides.
To stand up the container, just run the following command, setting GRAVWELL_CLEARTEXT_TARGETS to the IP(s) or hostname(s) of your Gravwell indexer(s), GRAVWELL_INGEST_SECRET to your ingest secret, and INTERFACE to the host interface you wish to monitor. You can also use the FILTER variable to set a BPF filter if desired.
docker run -d --name zeek --net host \
    -e GRAVWELL_CLEARTEXT_TARGETS="192.168.1.1,192.168.1.2" \
    -e GRAVWELL_INGEST_SECRET="IngestSecrets" \
    -e INTERFACE="eno1" \
    -e FILTER="not port 443" \
    gravwell/zeek:latest
You can verify that entries are making it to Gravwell by running a query like "tag=zeek*"; you should see entries before long.
If you decide to set up Zeek on your own, you'll need to configure it to output in tab-delimited format (not JSON) and you'll need an appropriate File Follower configuration (see Gravwell Docs-Ingesters). Here is an example ingester configuration from the Docker image (Ingester configuration). Full manual configuration of Zeek and the File Follower ingester is beyond the scope of this blog post, of course.
Installing the Zeek Kit
Install the Zeek kit like any other Gravwell kit: navigate to the kits page in the platform, click "Manage Kits", then open the "Available Kits" tab. Find the Zeek kit, click the "Deploy" button, and walk through the wizard. After a few seconds, the kit is installed!
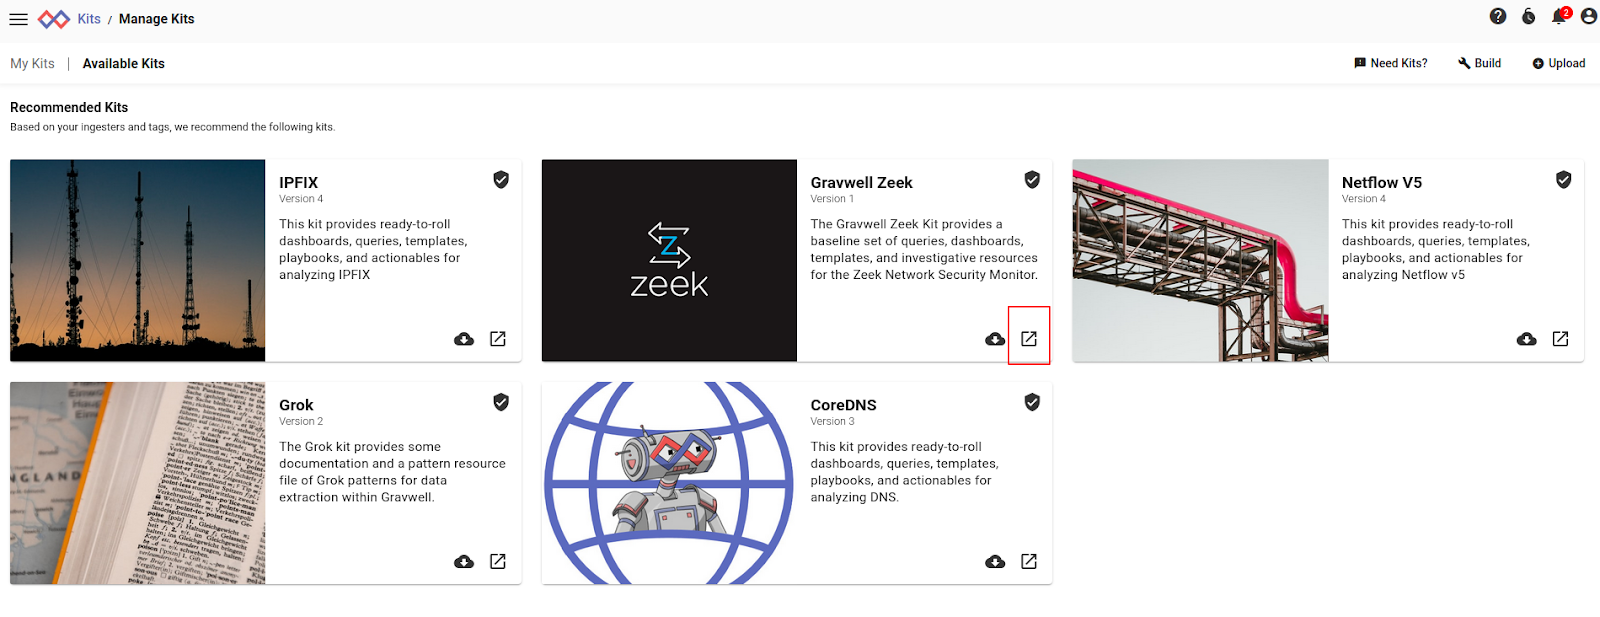
Once the installation is done, you should see a nice listing of the kit contents.
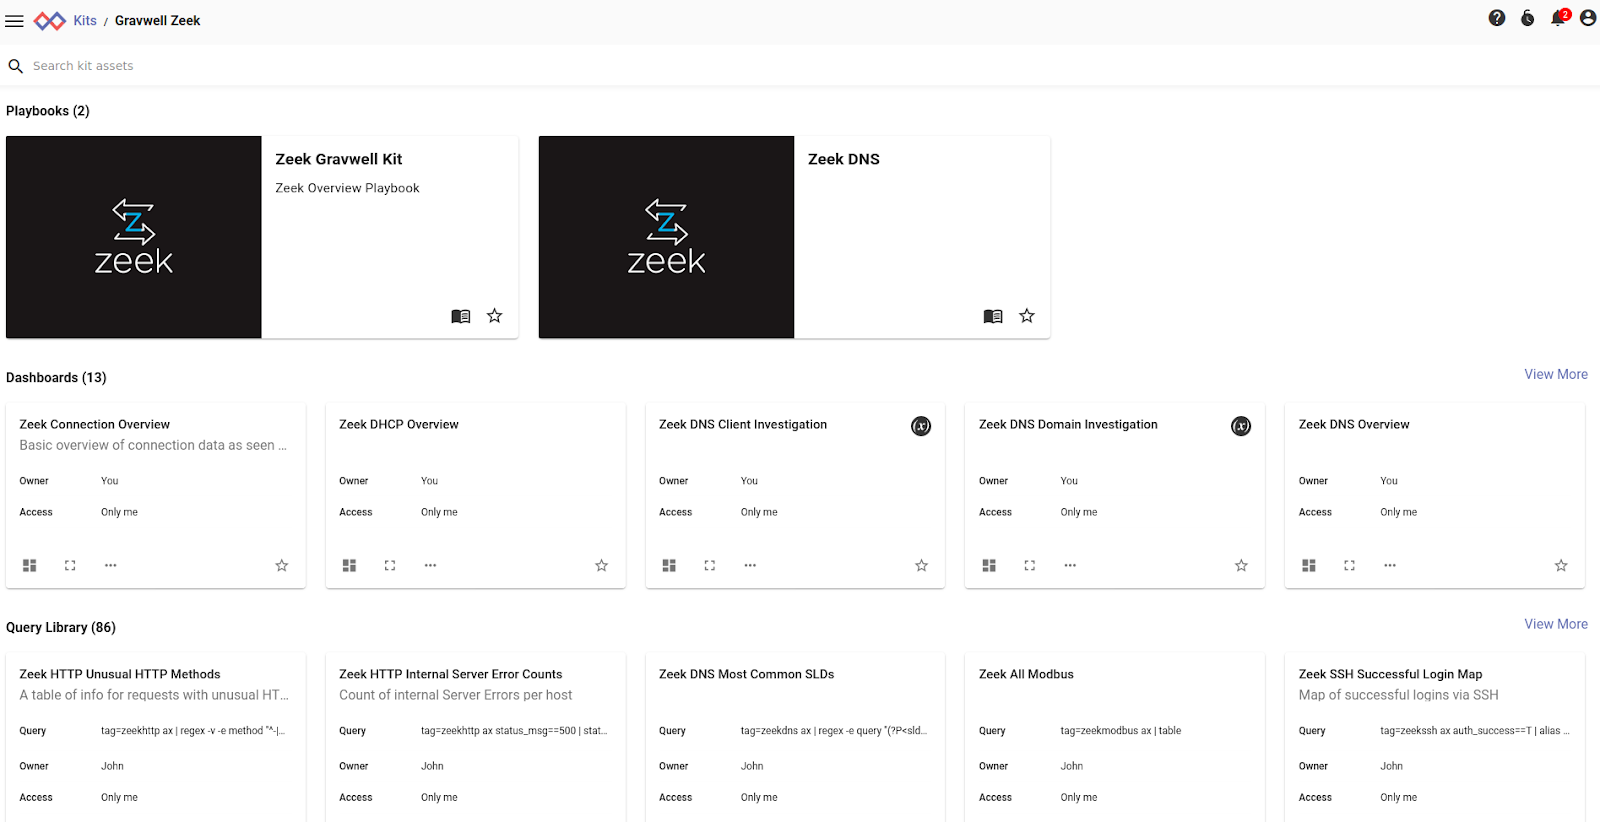
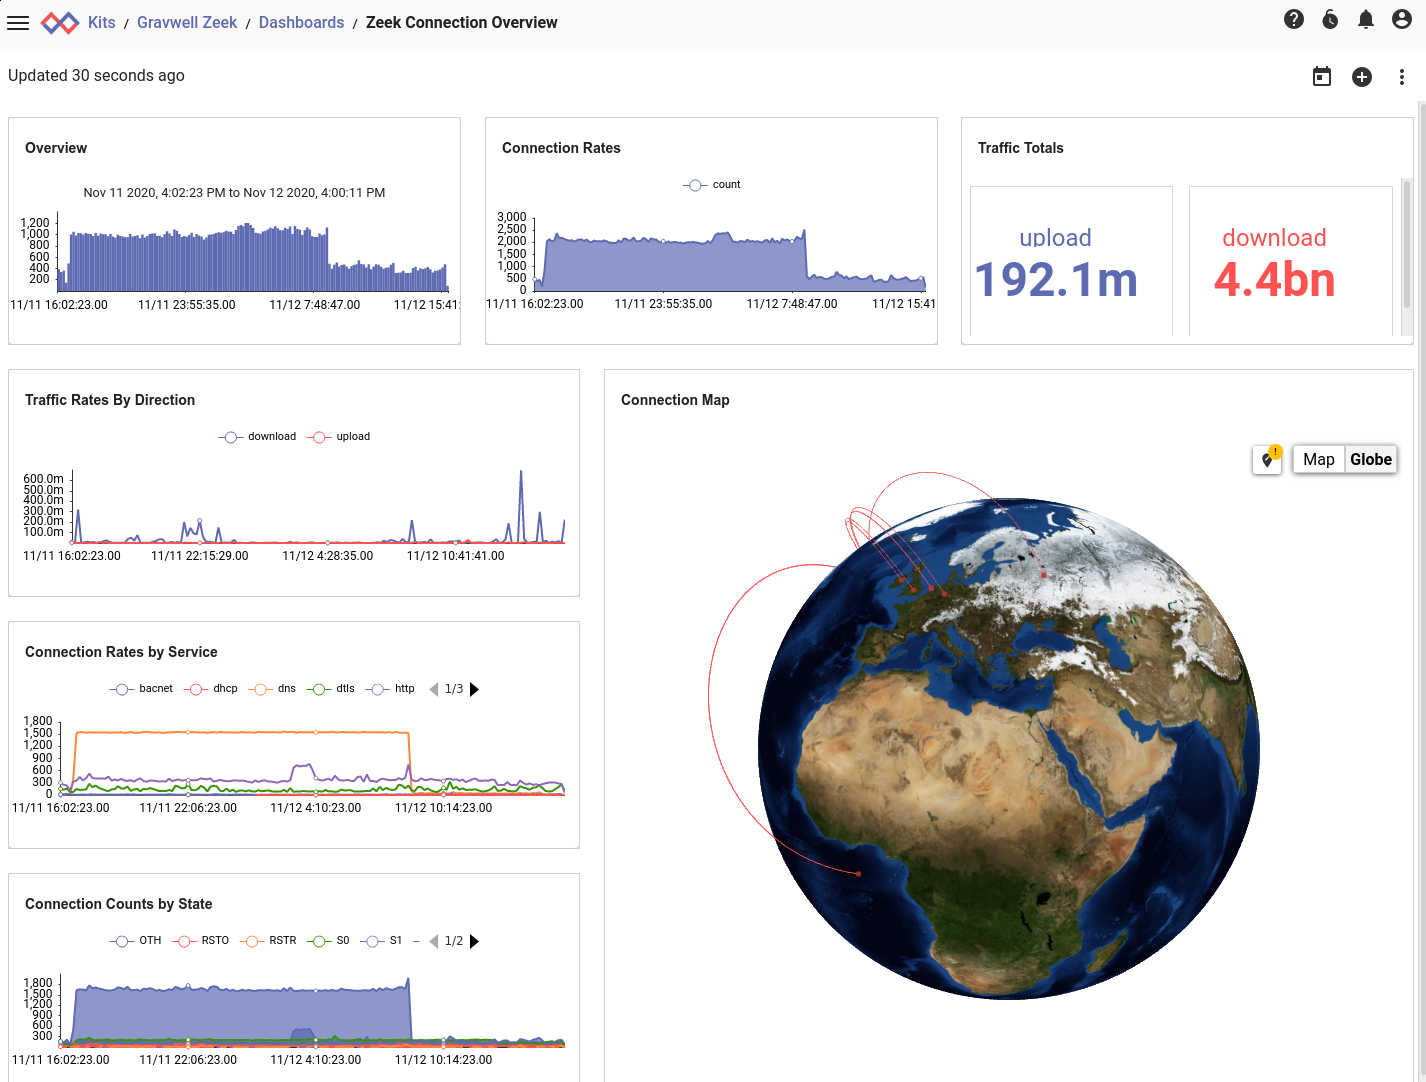
Click the "Zeek Connection Overview" dashboard to get your first 30,000-foot look at the Zeek data:
Playbooks and Autoextractors
Your next destination in the kit should be the overview playbook, named "Zeek Gravwell Kit". (To get back to the kit contents listing, click "Gravwell Zeek" at the top of the page) It's a high-level overview of what the kit provides. It also includes a section on configuring your indexer wells for best performance with Zeek. Briefly, you should ingest Zeek data into a dedicated, fulltext-indexed well. The following is a sample configuration that works well:
[Storage-Well "zeek"]
    Location=/opt/gravwell/storage/zeek
    Tags=zeek*
    Accelerator-Name=fulltext
    Accelerator-Args="-ignoreFloat -ignoreUUID"
    Accelerator-Engine-Override=index
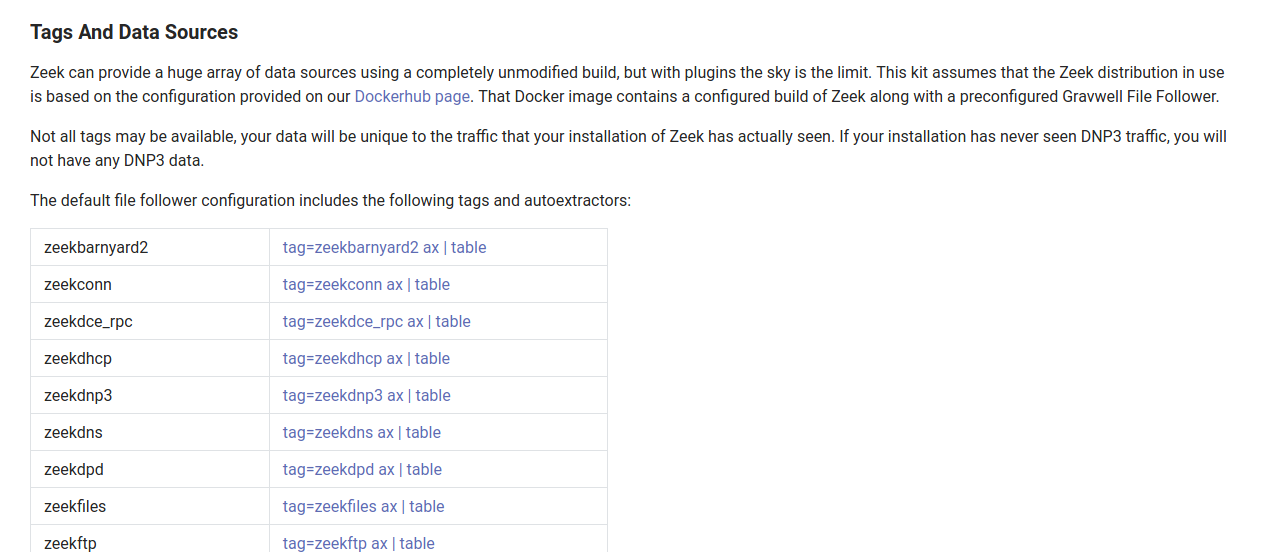
One extremely useful part of the overview playbook is the listing of tags and data sources. This enumerates all the different tags that will contain Zeek data, and includes clickable searches for each:
If you click on a query, for example "tag=zeekdns ax | table", a new window will open with that query executed over the last hour:
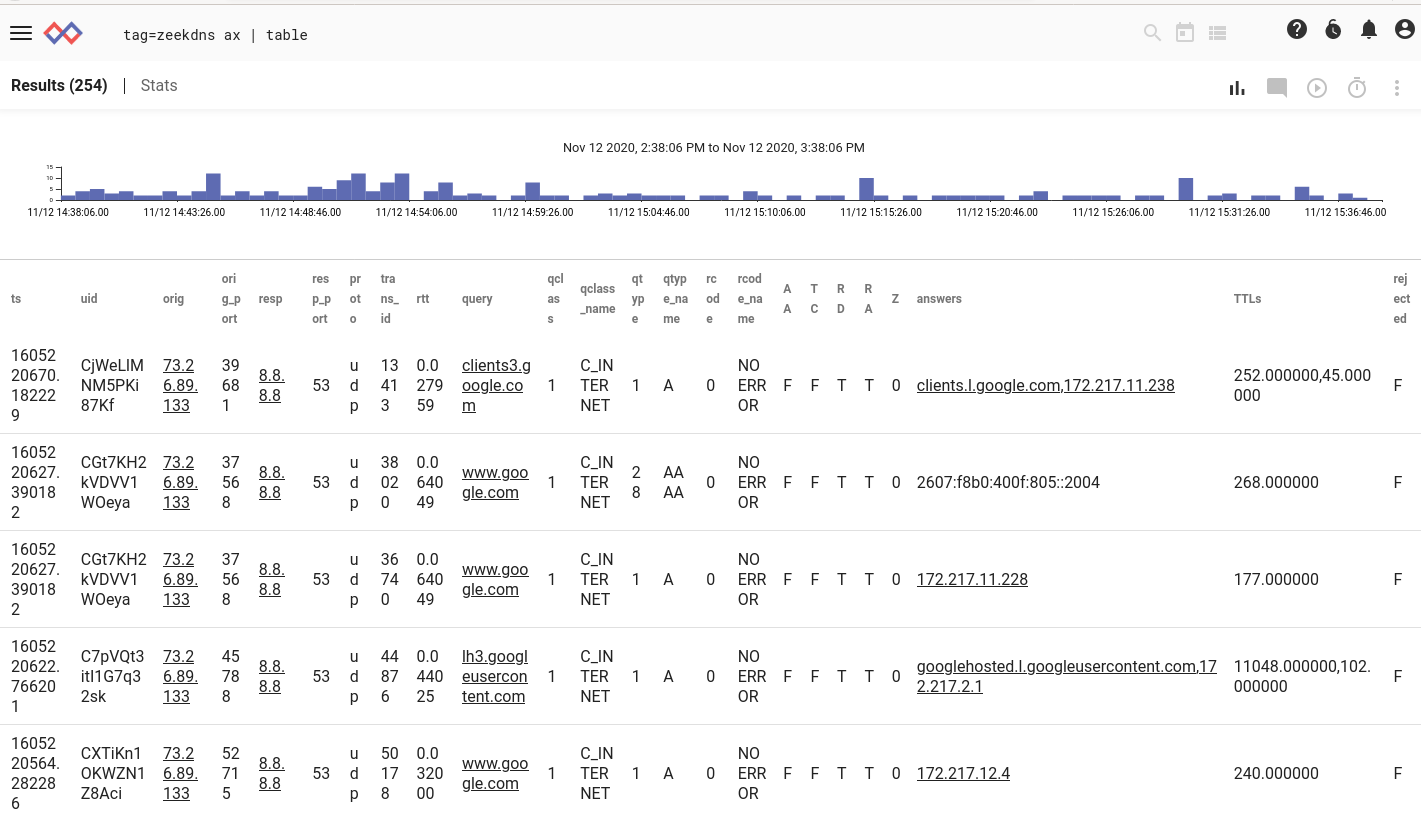
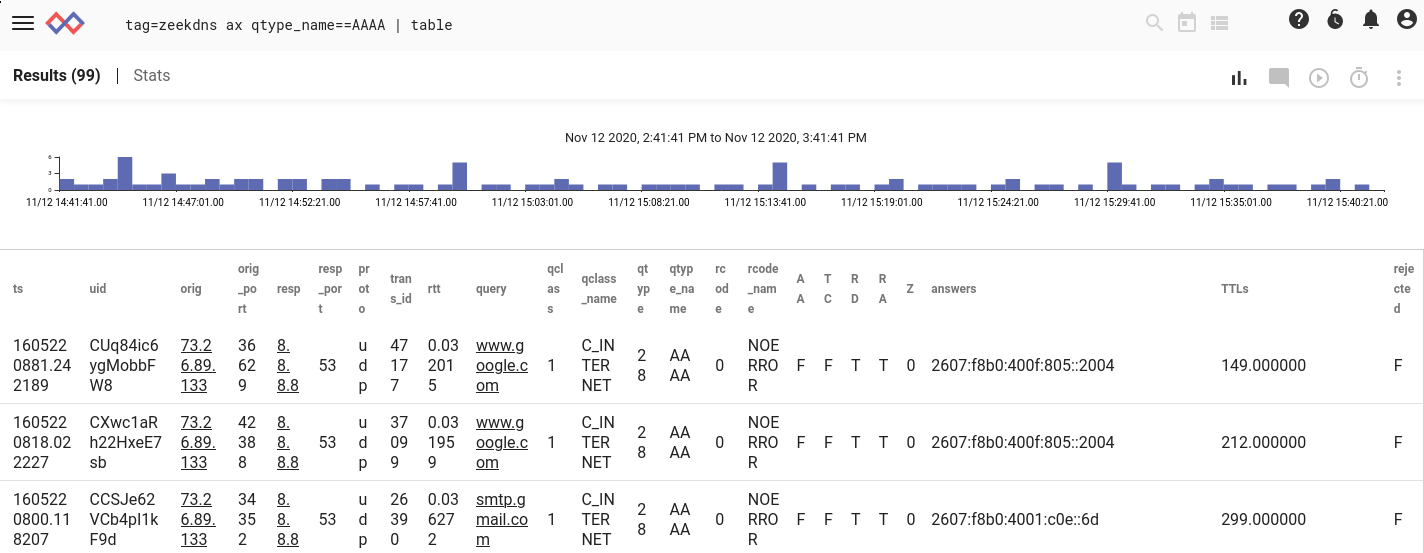
The columns are a little crowded because there are so many fields, but thanks to the auto-extractors shipped with the kit, each field has been broken out properly. I can then easily filter down, for example restricting my results to only those DNS queries which get an IPv6 response:
Dashboards & Actionables
The Zeek kit comes with an array of pre-built dashboards, covering overall network traffic, DHCP, DNS, HTTP, SMB, SSH, SSL, and network tunnels. It also includes investigative dashboards, which take an input (such as an IP address or a DNS name) and pull back information about that particular thing.
The kit also ships actionables, which are little bits of logic the web interface uses to make certain bits of information clickable. We've included actionables that let you click on an IP address or hostname and send it directly to an investigative dashboard, meaning you can do quite a lot of poking around without writing any queries at all!
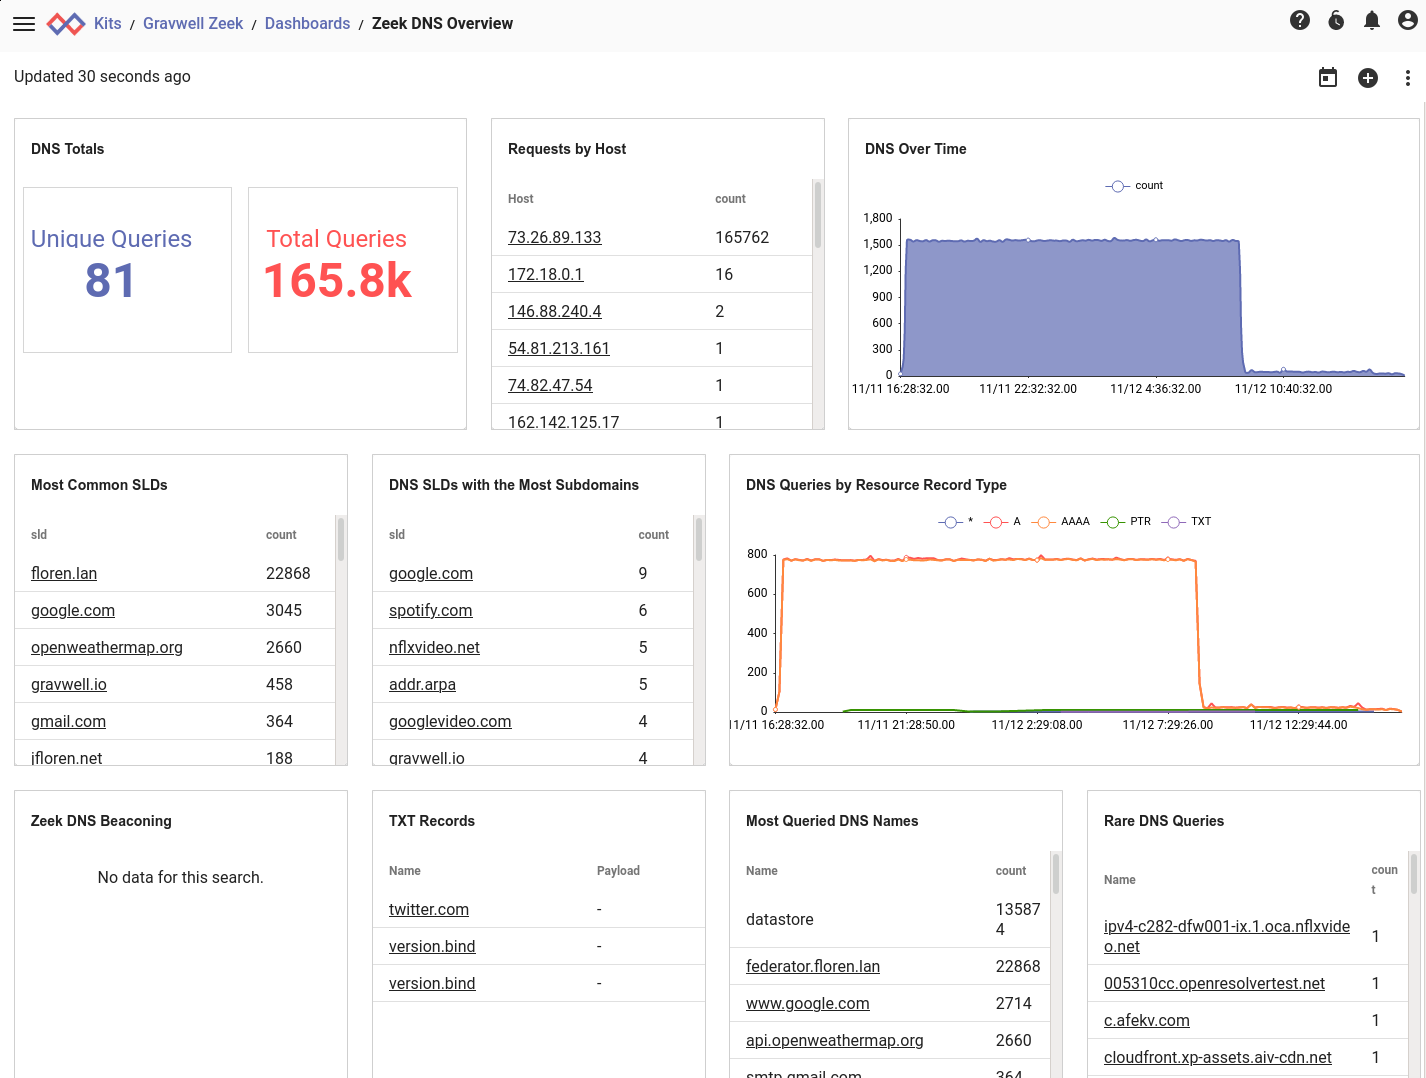
For example, if I load up my DNS overview dashboard, I see that there were a LOT of lookups on "floren.lan", the internal domain I use at home:
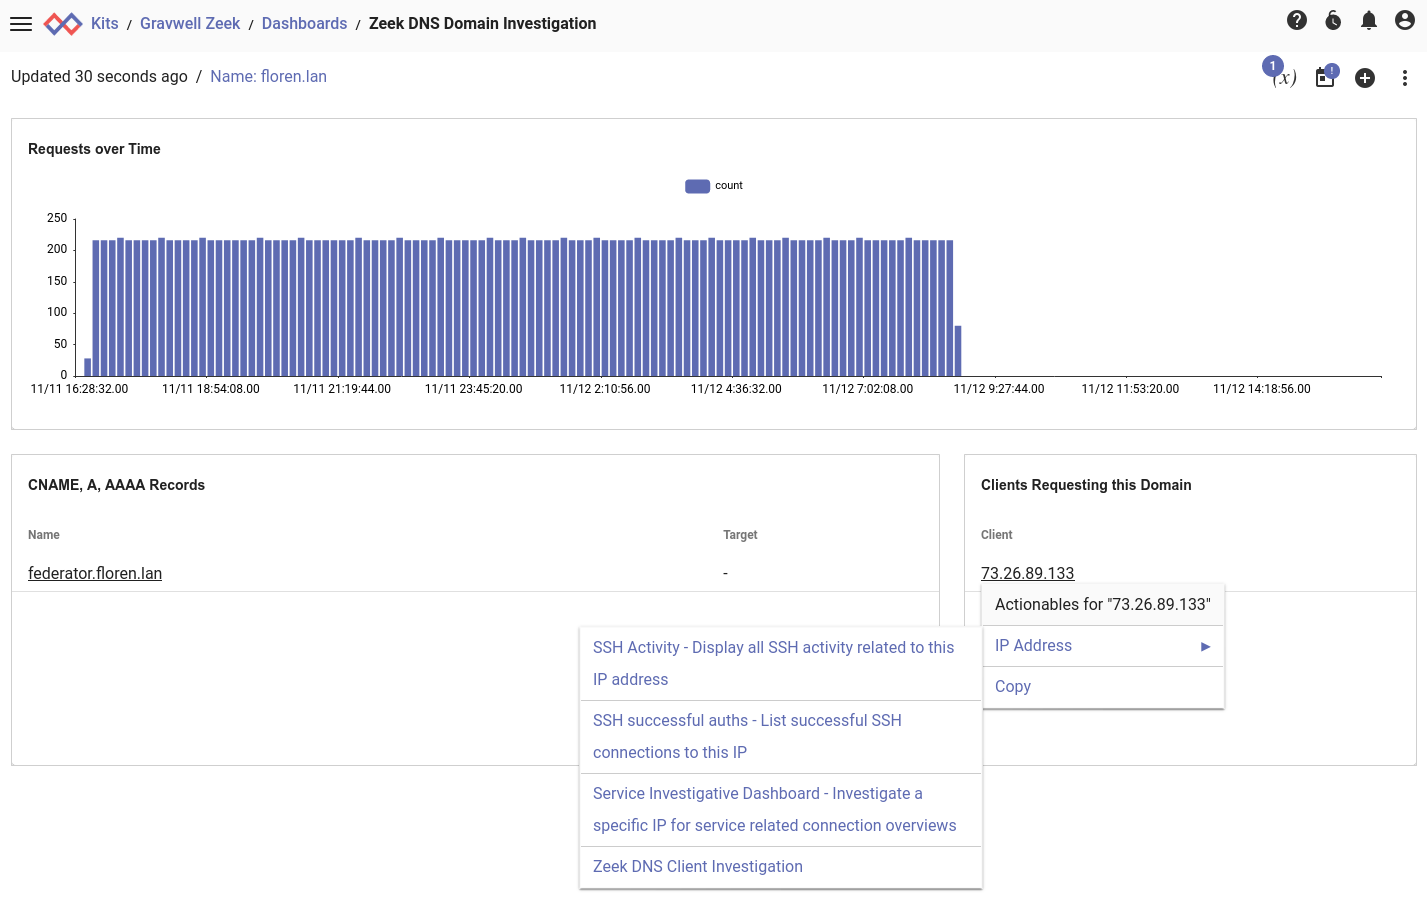
Because the name is underlined, I know it has an actionable associated with it, so I click on "floren.lan" and a context menu pops up:
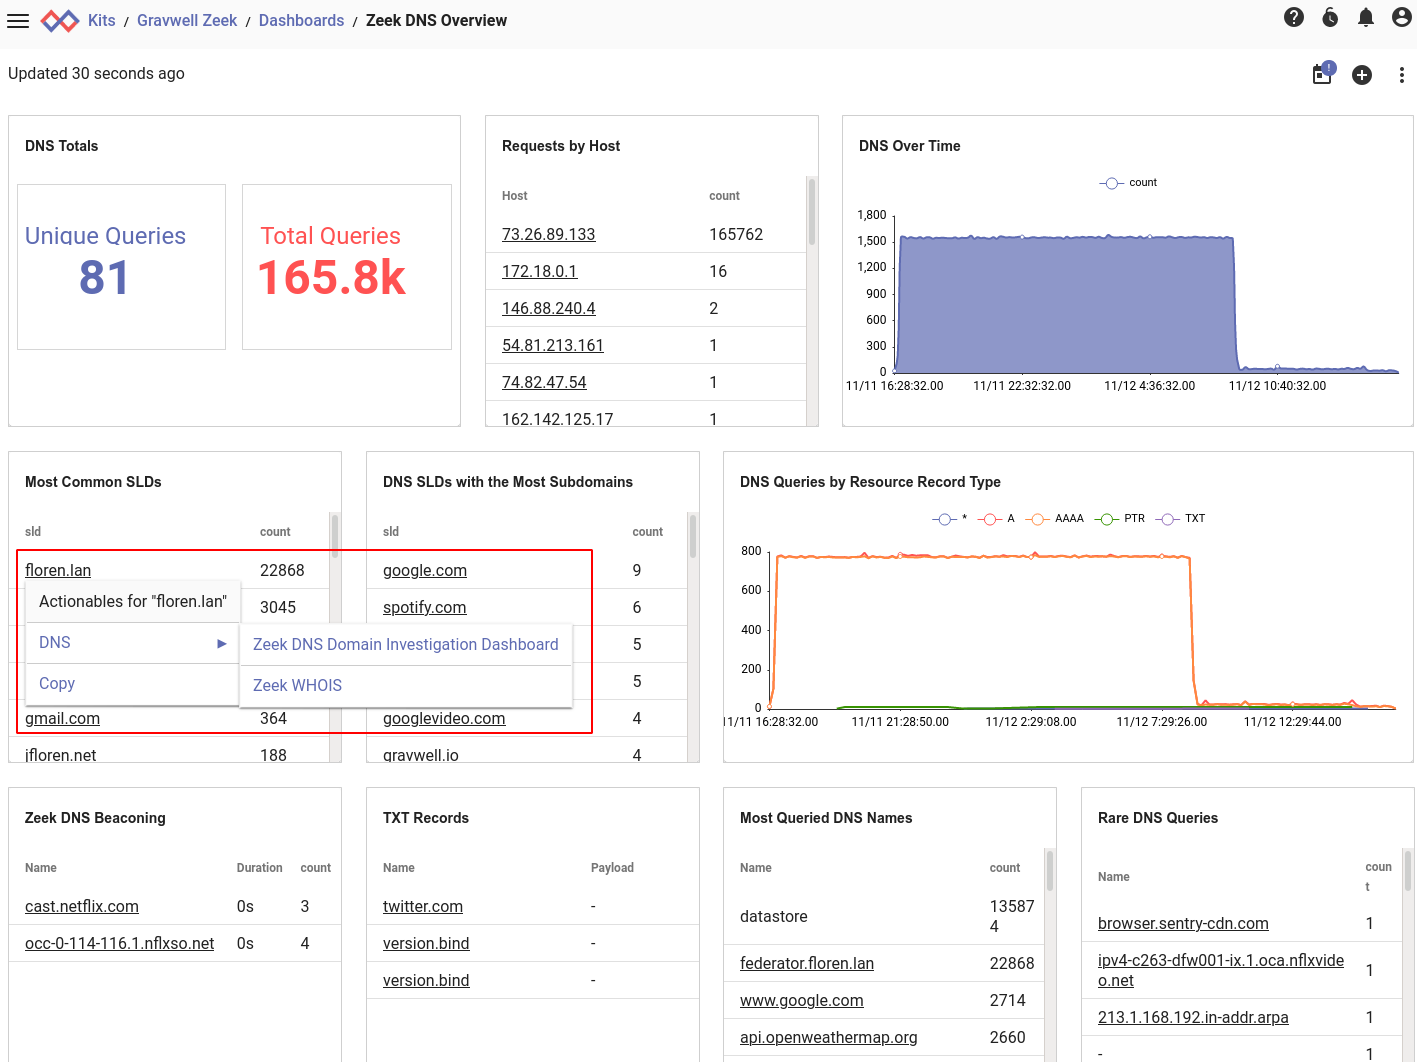
Since I want to do some more investigation on that domain, I select "Zeek DNS Domain Investigation Dashboard".
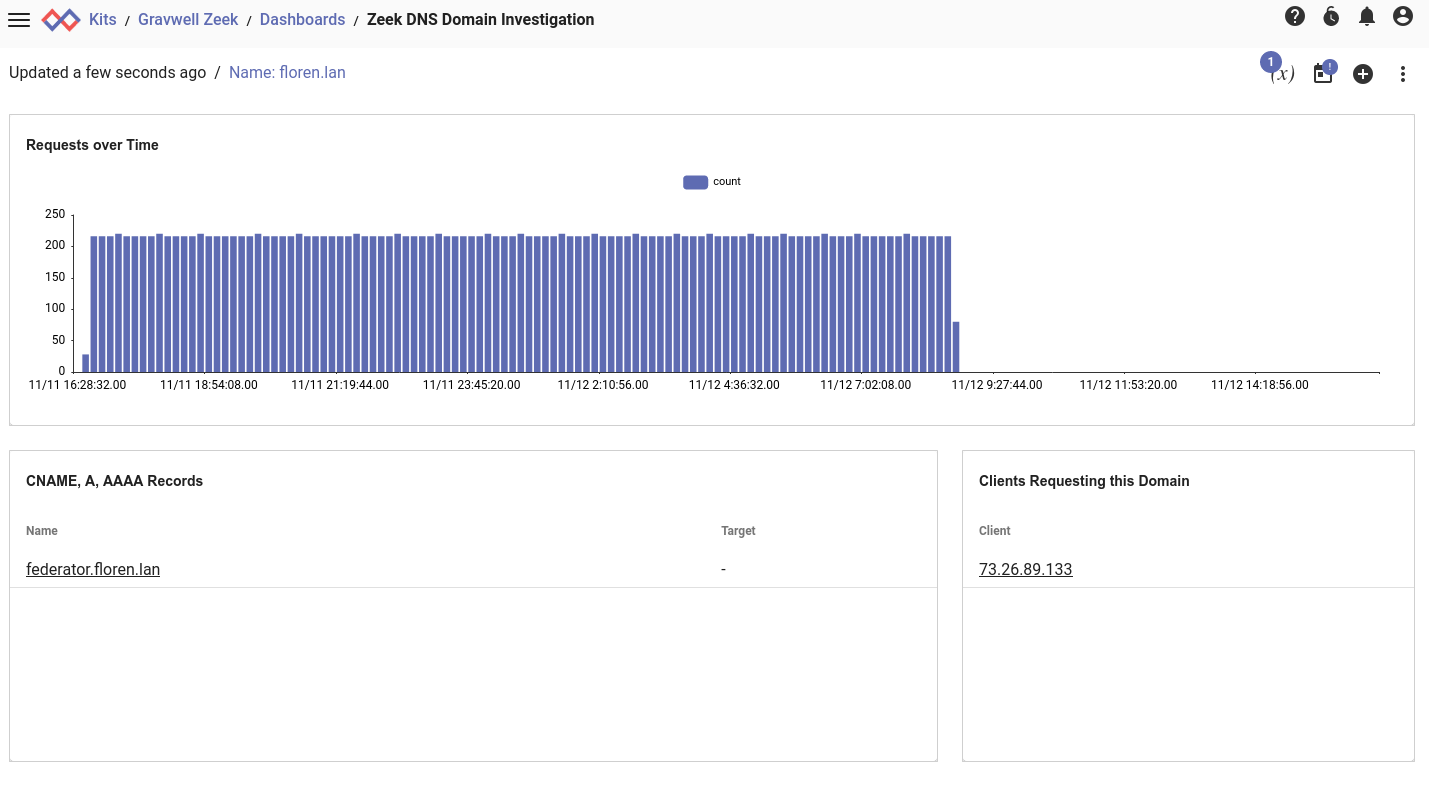
Here, I can see that all the requests were for "federator.floren.lan". I also note that the requests dropped off sharply this morning. It turns out that I had a mis-configured Docker container running which was incorrectly trying to reach "federator.floren.lan" when it should have been using the Docker-internal hostname "federator". You can see where I fixed that this morning!
From within this dashboard, I could now choose to click on the IP address and pivot from there to another investigation--like investigating SSH activity:
The Zeek UID Actionable
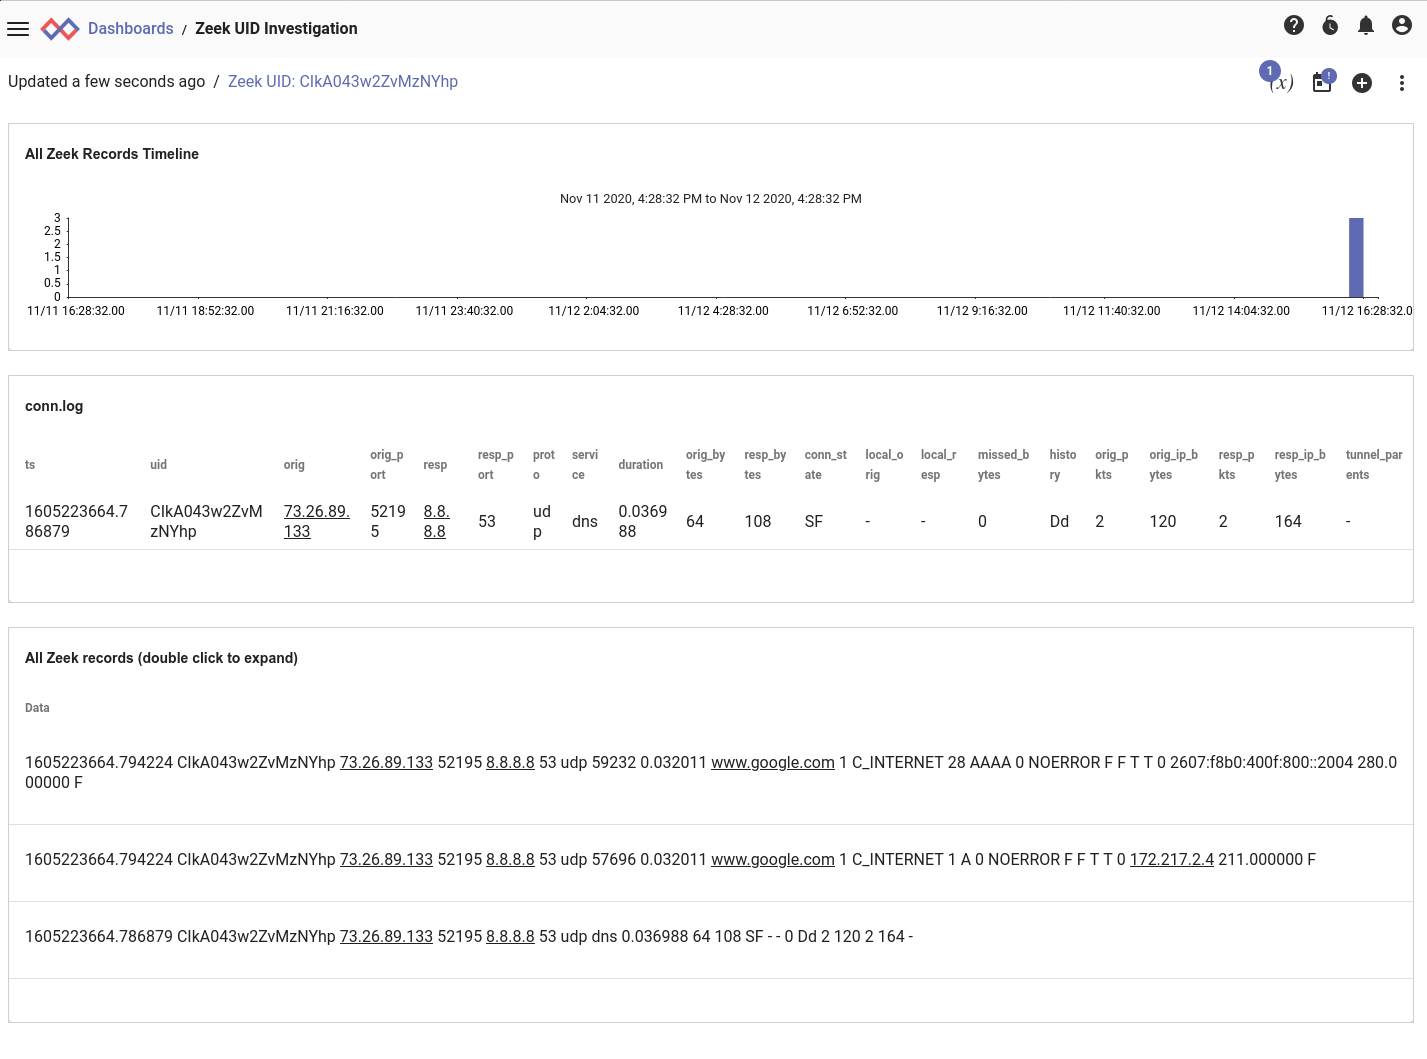
One final note: the kit includes an actionable for Zeek UID fields. A UID represents a single connection/event, but as we said earlier, a single connection can result in multiple entries in different logs. Each of these entries will have the same UID, which you can use to cross-reference.
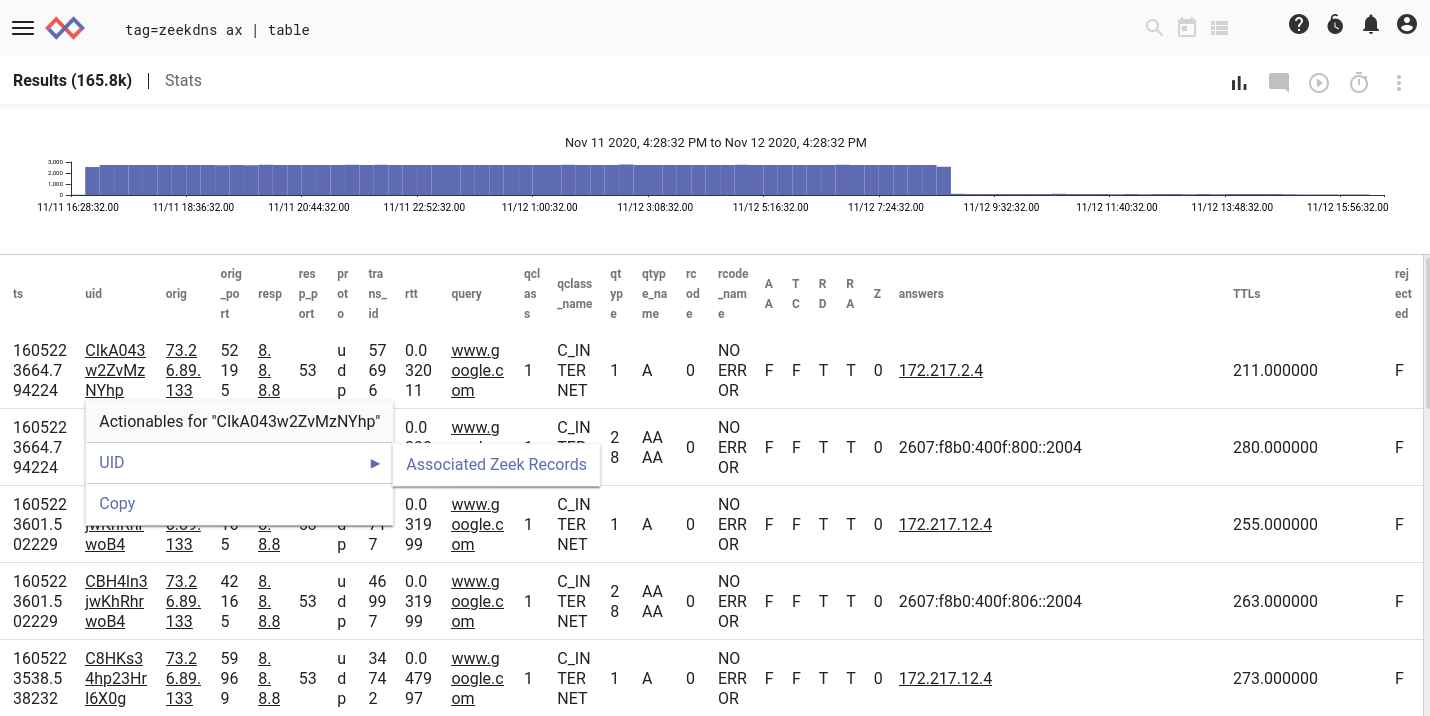
If I select "Associated Zeek Records", I can see all records which share that UID.
Conclusion
Every tier of Gravwell ships with ready-to-install kits (such as CoreDNS, Netflow, Grok, IPFIX, and the new Zeek kit) that get you up & running in a matter of minutes. I've only scratched the surface of the Zeek kit here. It includes 2 playbooks, 13 dashboards, 86 pre-built queries, and dozens of other helpful little bits & bobs--and we intend to keep expanding it over time. Between our Docker container and the kit, it's ridiculously easy to start analyzing Zeek in Gravwell. If you're not already using Gravwell, schedule a walk-through using the button below, and one of our Gravwell Guides can show you how to go from zero to Zeek hero using our feature-packed new kit.