Overview
When it comes to open source routers and firewalls, pfSense® software is a popular choice. It is a “batteries included” sort of software distribution that includes a firewall, DNS resolver, DHCP server, VPN servers, VPN clients, and diagnostic tools as well as a wide range of other bells and whistles right out of the box. To make those features even better, pfSense® software has a convenient web interface which makes it easy to set up and configure. Extra packages are also available through a package manager, which makes it easy to add and configure additional functionality and keep software up-to-date.
The web interface for pfSense® software does include a way to view and filter through system logs, but it leaves a lot to be desired. With the default interface, one can’t reasonably perform complex queries or threat hunt… but Gravwell can!
pfSense® software uses syslogd to manage logs, and its web interface makes it super simple to forward logs to Gravwell. To get started, it’s as easy as installing Gravwell Simple Relay, adding the following configuration…
[Listener "pfsensesyslogudp"]
Bind-String="udp://0.0.0.0:515" #standard UDP based RFC5424 syslog
Reader-Type=rfc5424
Tag-Name=pfsensesyslog
Assume-Local-Timezone=true
… and enabling remote logging in the pfSense® web interface.
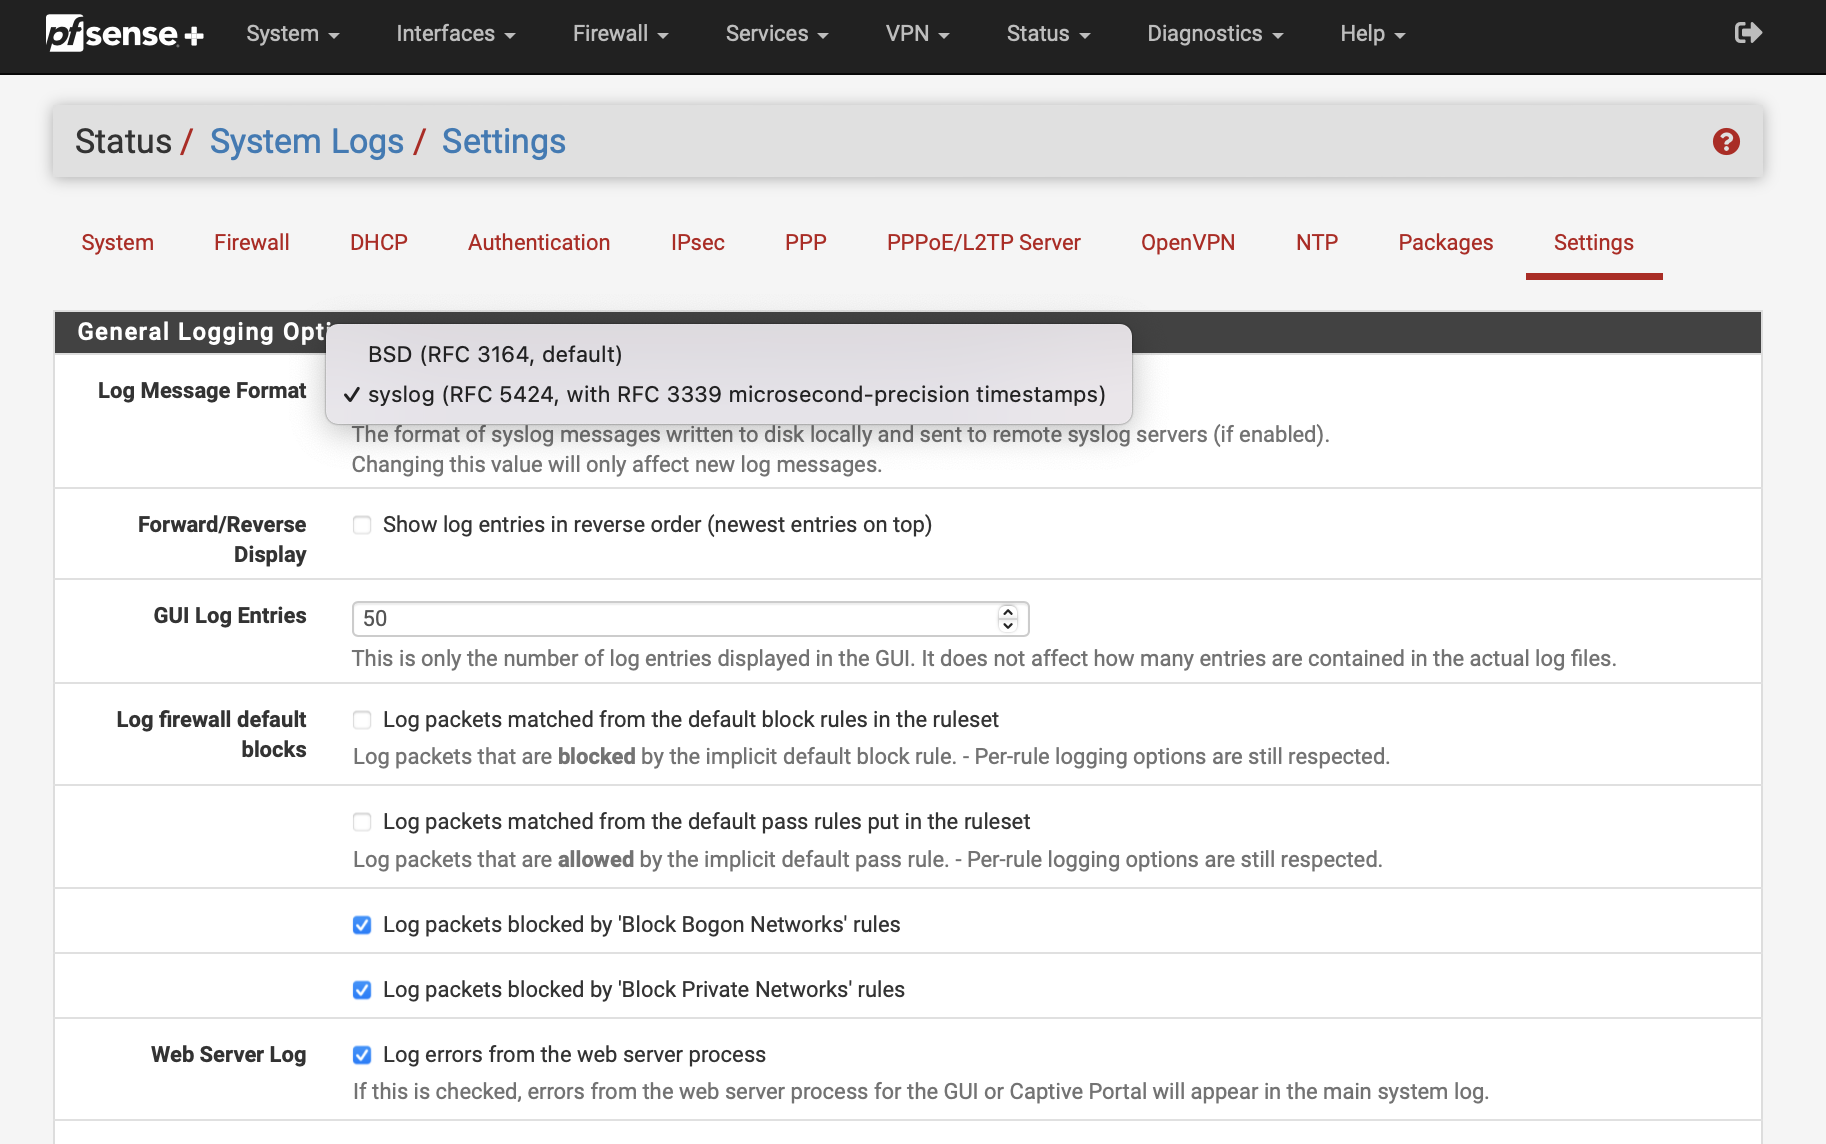 Login to your pfSense® installation and go to Status -> System Logs -> Settings. There, make sure that your Log Message Format is set to “syslog (RFC 5424)”
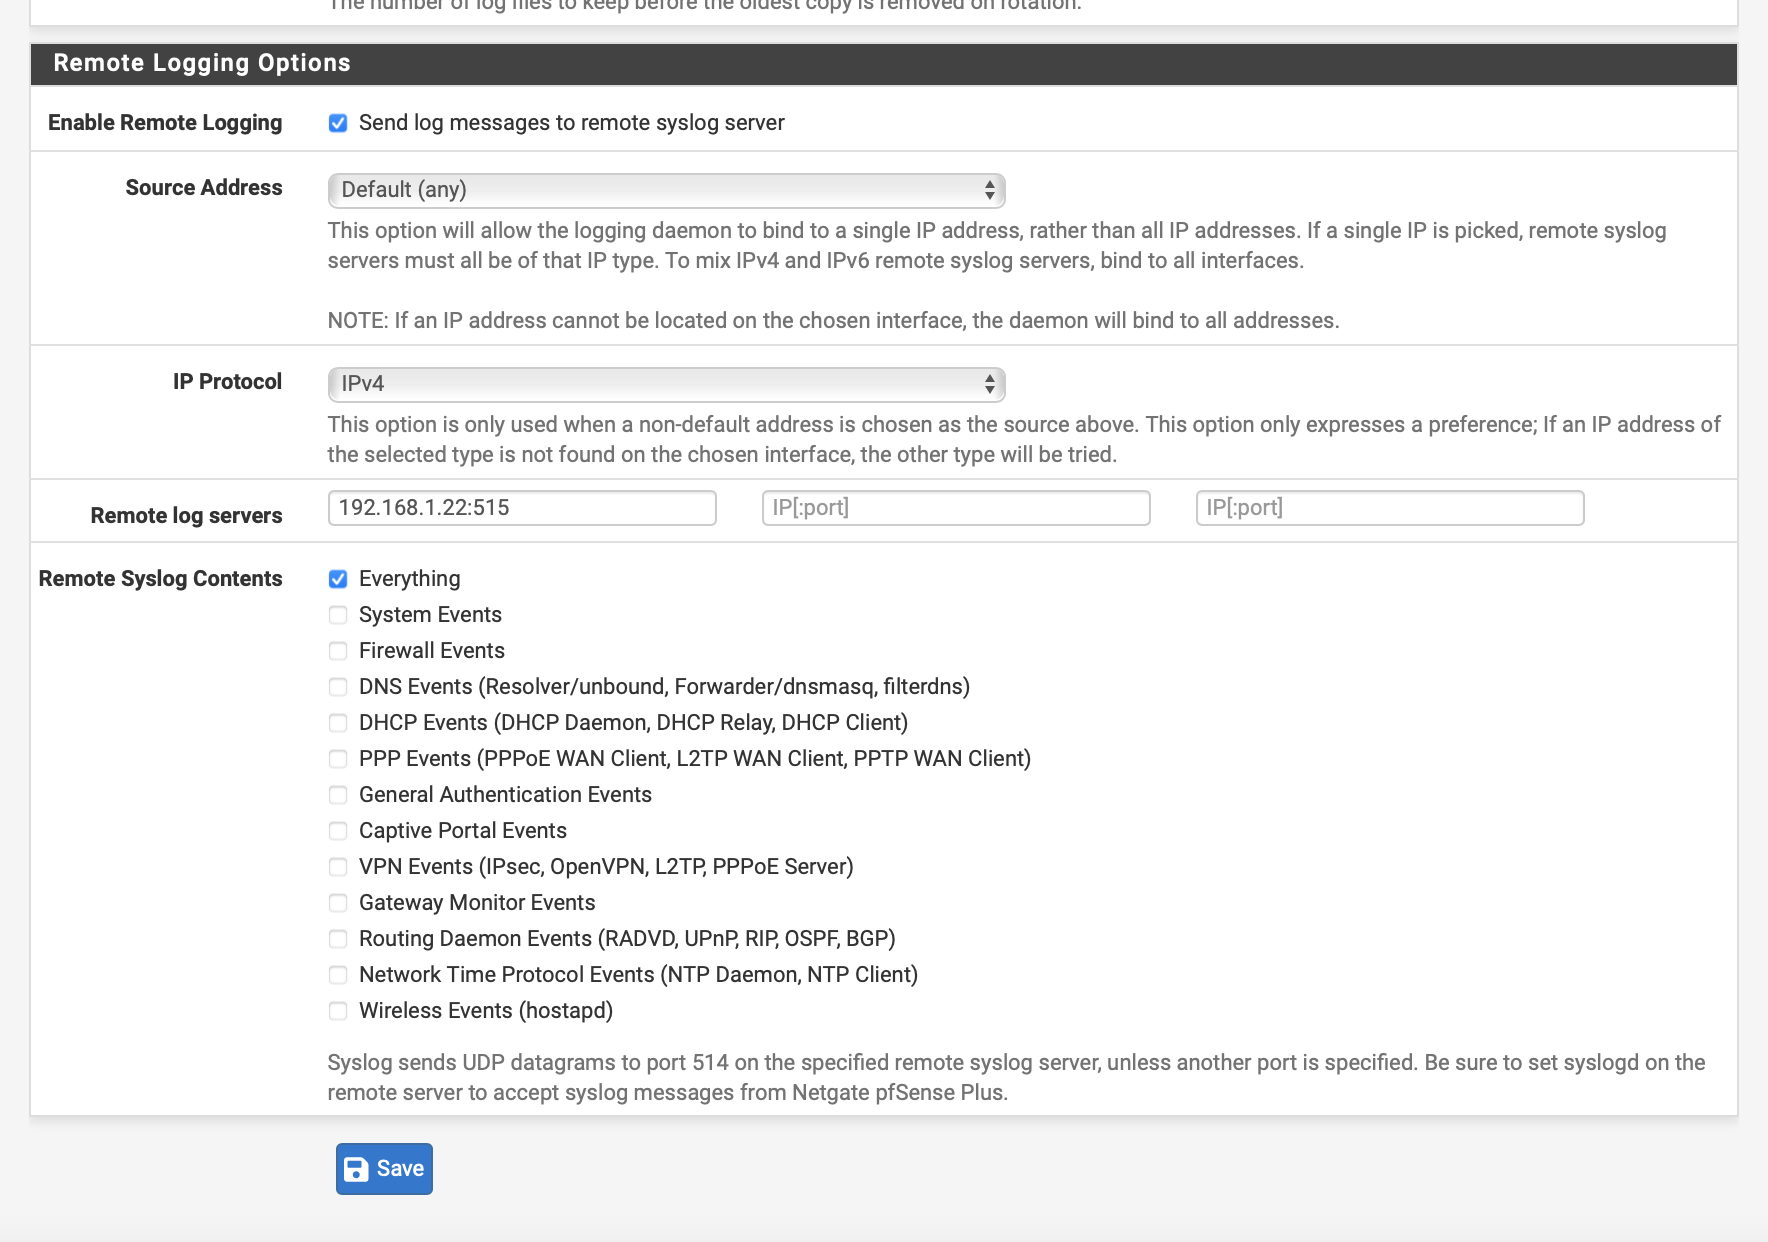
On the same page, scroll to the bottom, check “Enable Remote Logging”, set one of the “Remote log servers” to your Simple Relay Ingester, and choose your “Remote Syslog Contents”. “Everything” is a good choice. Don’t forget to save!
At this point, Gravwell will be ingesting syslog messages generated by your pfSense® installation. Now, we can pull up the Gravwell web interface and query away!
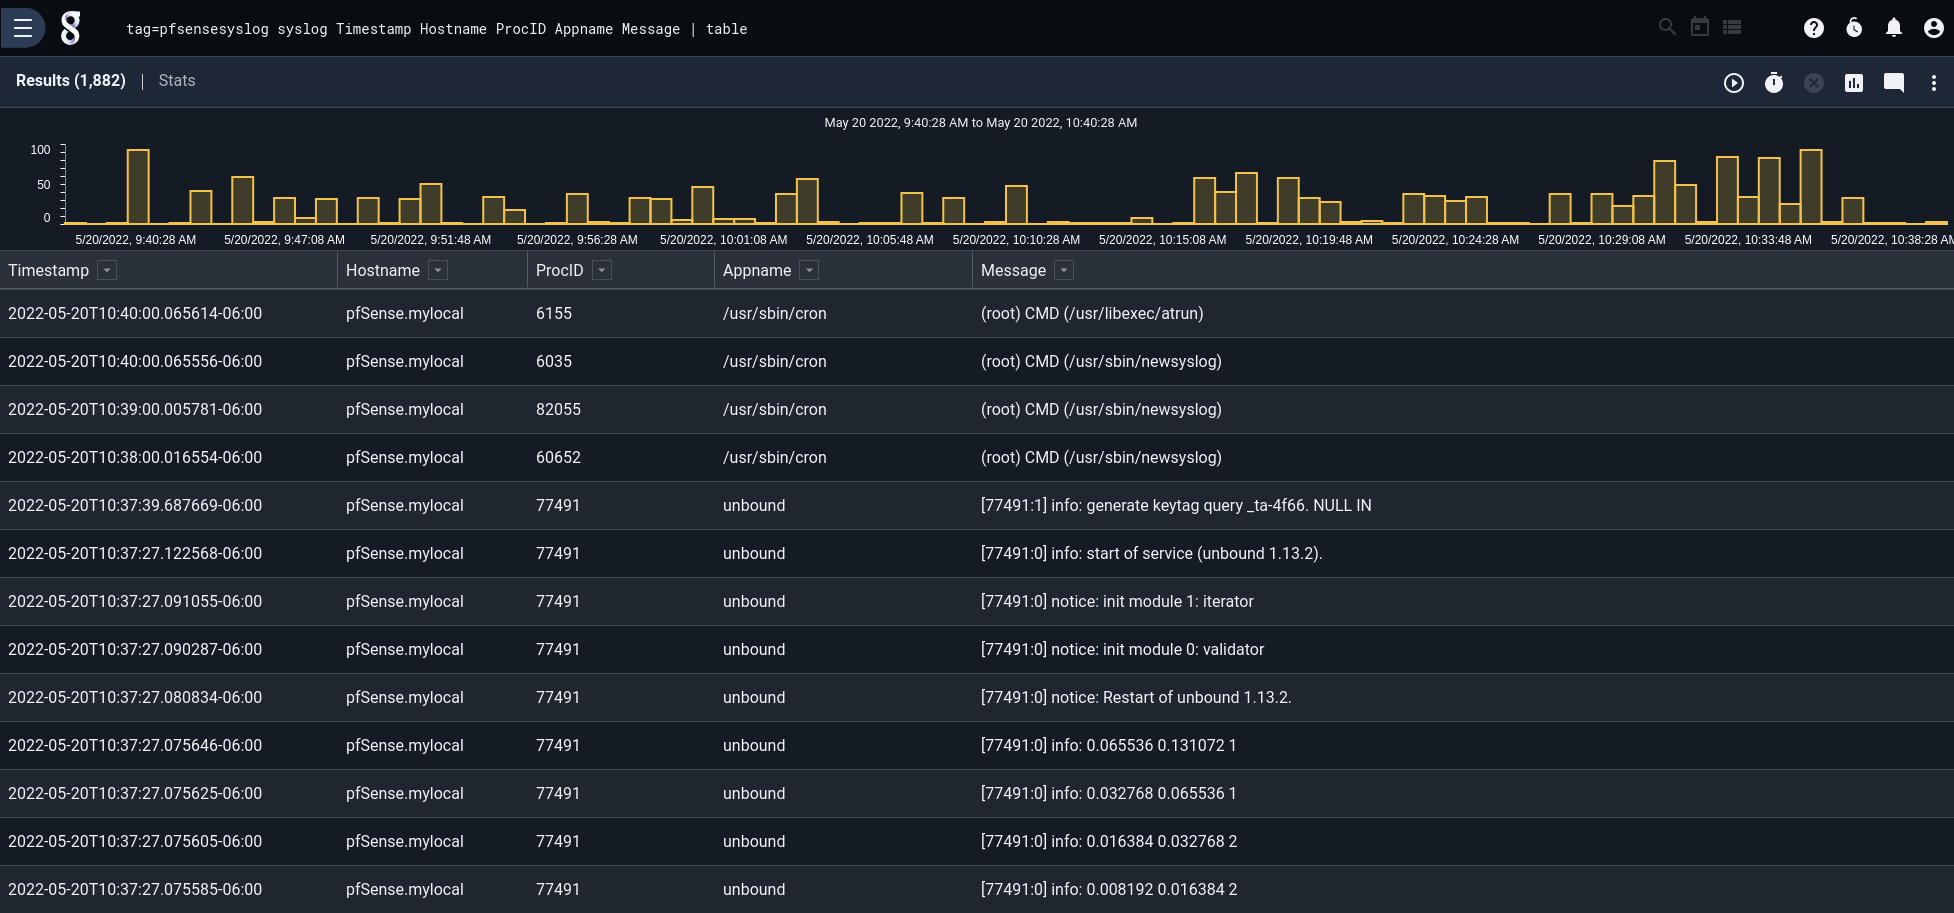 Since we’ve configured the pfSense® software to send log messages as syslog, we can use the “syslog” module to examine the contents of the logs. Fields like appname, message, facility, and priority are easy to break out and use in filters.
Filterlog
As you browse your logs, one app name in particular may catch your attention: “filterlog”. The “filterlog” app name is used for log’s coming from the pfSense® firewall.
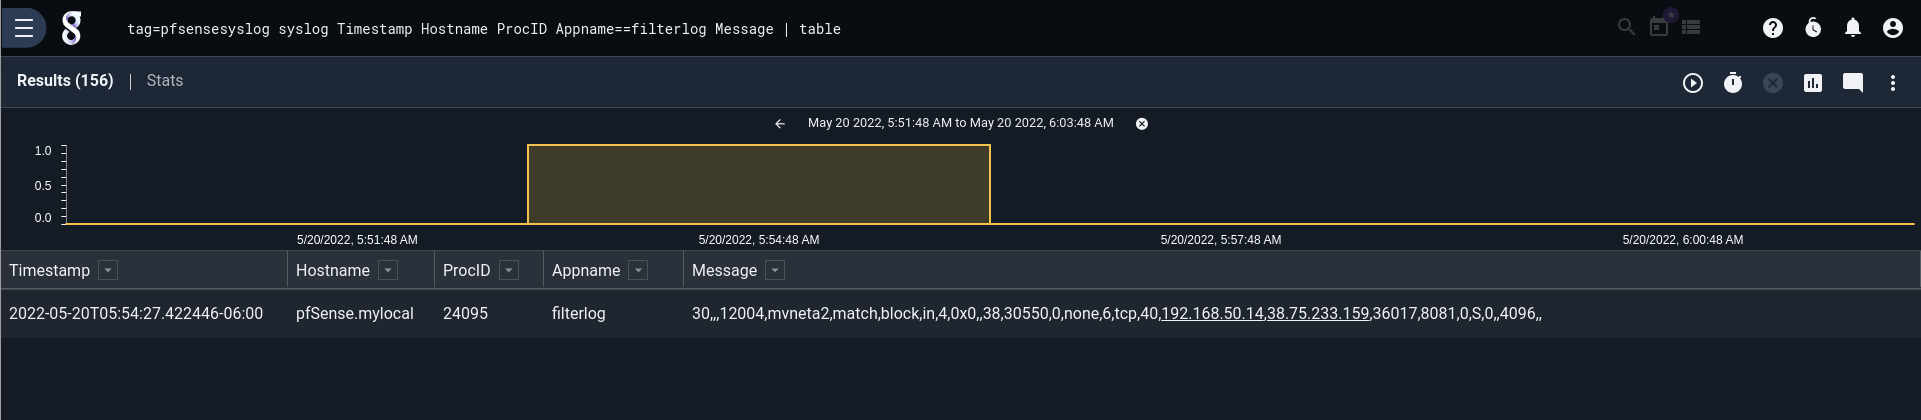
The “filterlog” log entries look like any other syslog entry, but on closer inspection the “message” part of the field is a bit hard to understand. The Message is clearly a string of comma-separated values, but what do those values mean?
The short answer is “it’s complicated.”
The long answer is that the columns of the CSV depend on the values in that same line of CSV. For example, the 9th value in the CSV is always the IP version of the packet from the firewall event. If the IP version is 4, then the 10th value is the Type of Service identification. However, if the IP version is 6, then the 10th value is the Type of Service class.
IP Version is not the only field that indicates the meaning of other fields. There are several columns whose values affect other columns in the CSV. The interested reader may checkout the documentation for more information:
Because the columns in the filterlog CSV vary in such a complex way, it’s not realistic for a human to be able to understand what the firewall log message is describing. There’s actually a lot of really useful information in that line that can answer some important questions:
- Which firewall rule was enforced?
- Which interface was it enforced on?
- Which action did the firewall take? Did it pass or block?
- What was the direction of the traffic?
Gravwell Kit
To get answers to these questions, we can install the Gravwell Kit for pfSense® Software. Among other useful tools, the kit includes a script that can break apart the filterlog CSV messages on the fly, so users can make sense of their firewall’s logs.
One thing that’s worth noting is that we didn’t have to do anything special to ingest syslog or filterlog logs from our pfSense® software. One of the great things about Gravwell is that it’s possible (and encouraged) to start ingesting your logs right away and worry about the structure of it later. It doesn’t matter if you’re ingesting syslog or binary or wacky CSV, Gravwell will ingest it – there’s no need to fuss with figuring out the structure ahead of time. Your data is saved and waiting for you to explore it.
Once the kit is installed, it’s easy to issue queries over firewall logs. Simply run the logs through the ParseFilterlog anko script like so:
tag=$PFSENSE_SYSLOG_TAG syslog Appname == "filterlog" Message Timestamp| anko ParseFilterlog| table
The above query filters down to just those messages with the “filterlog” app name, parses those entries with the ParseFilterlog script, and renders them as a table:
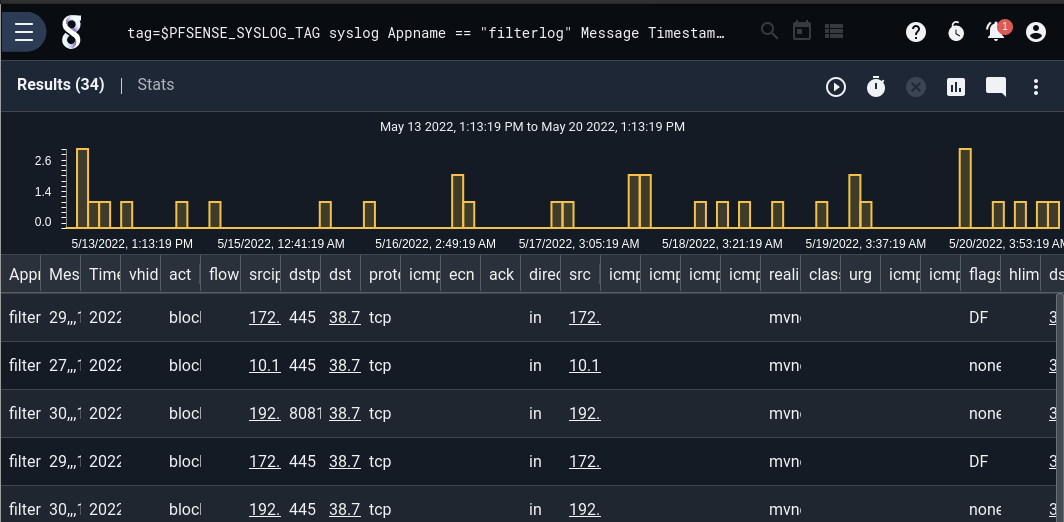
Of course, the lengthy filterlog CSV produces quite a few columns!
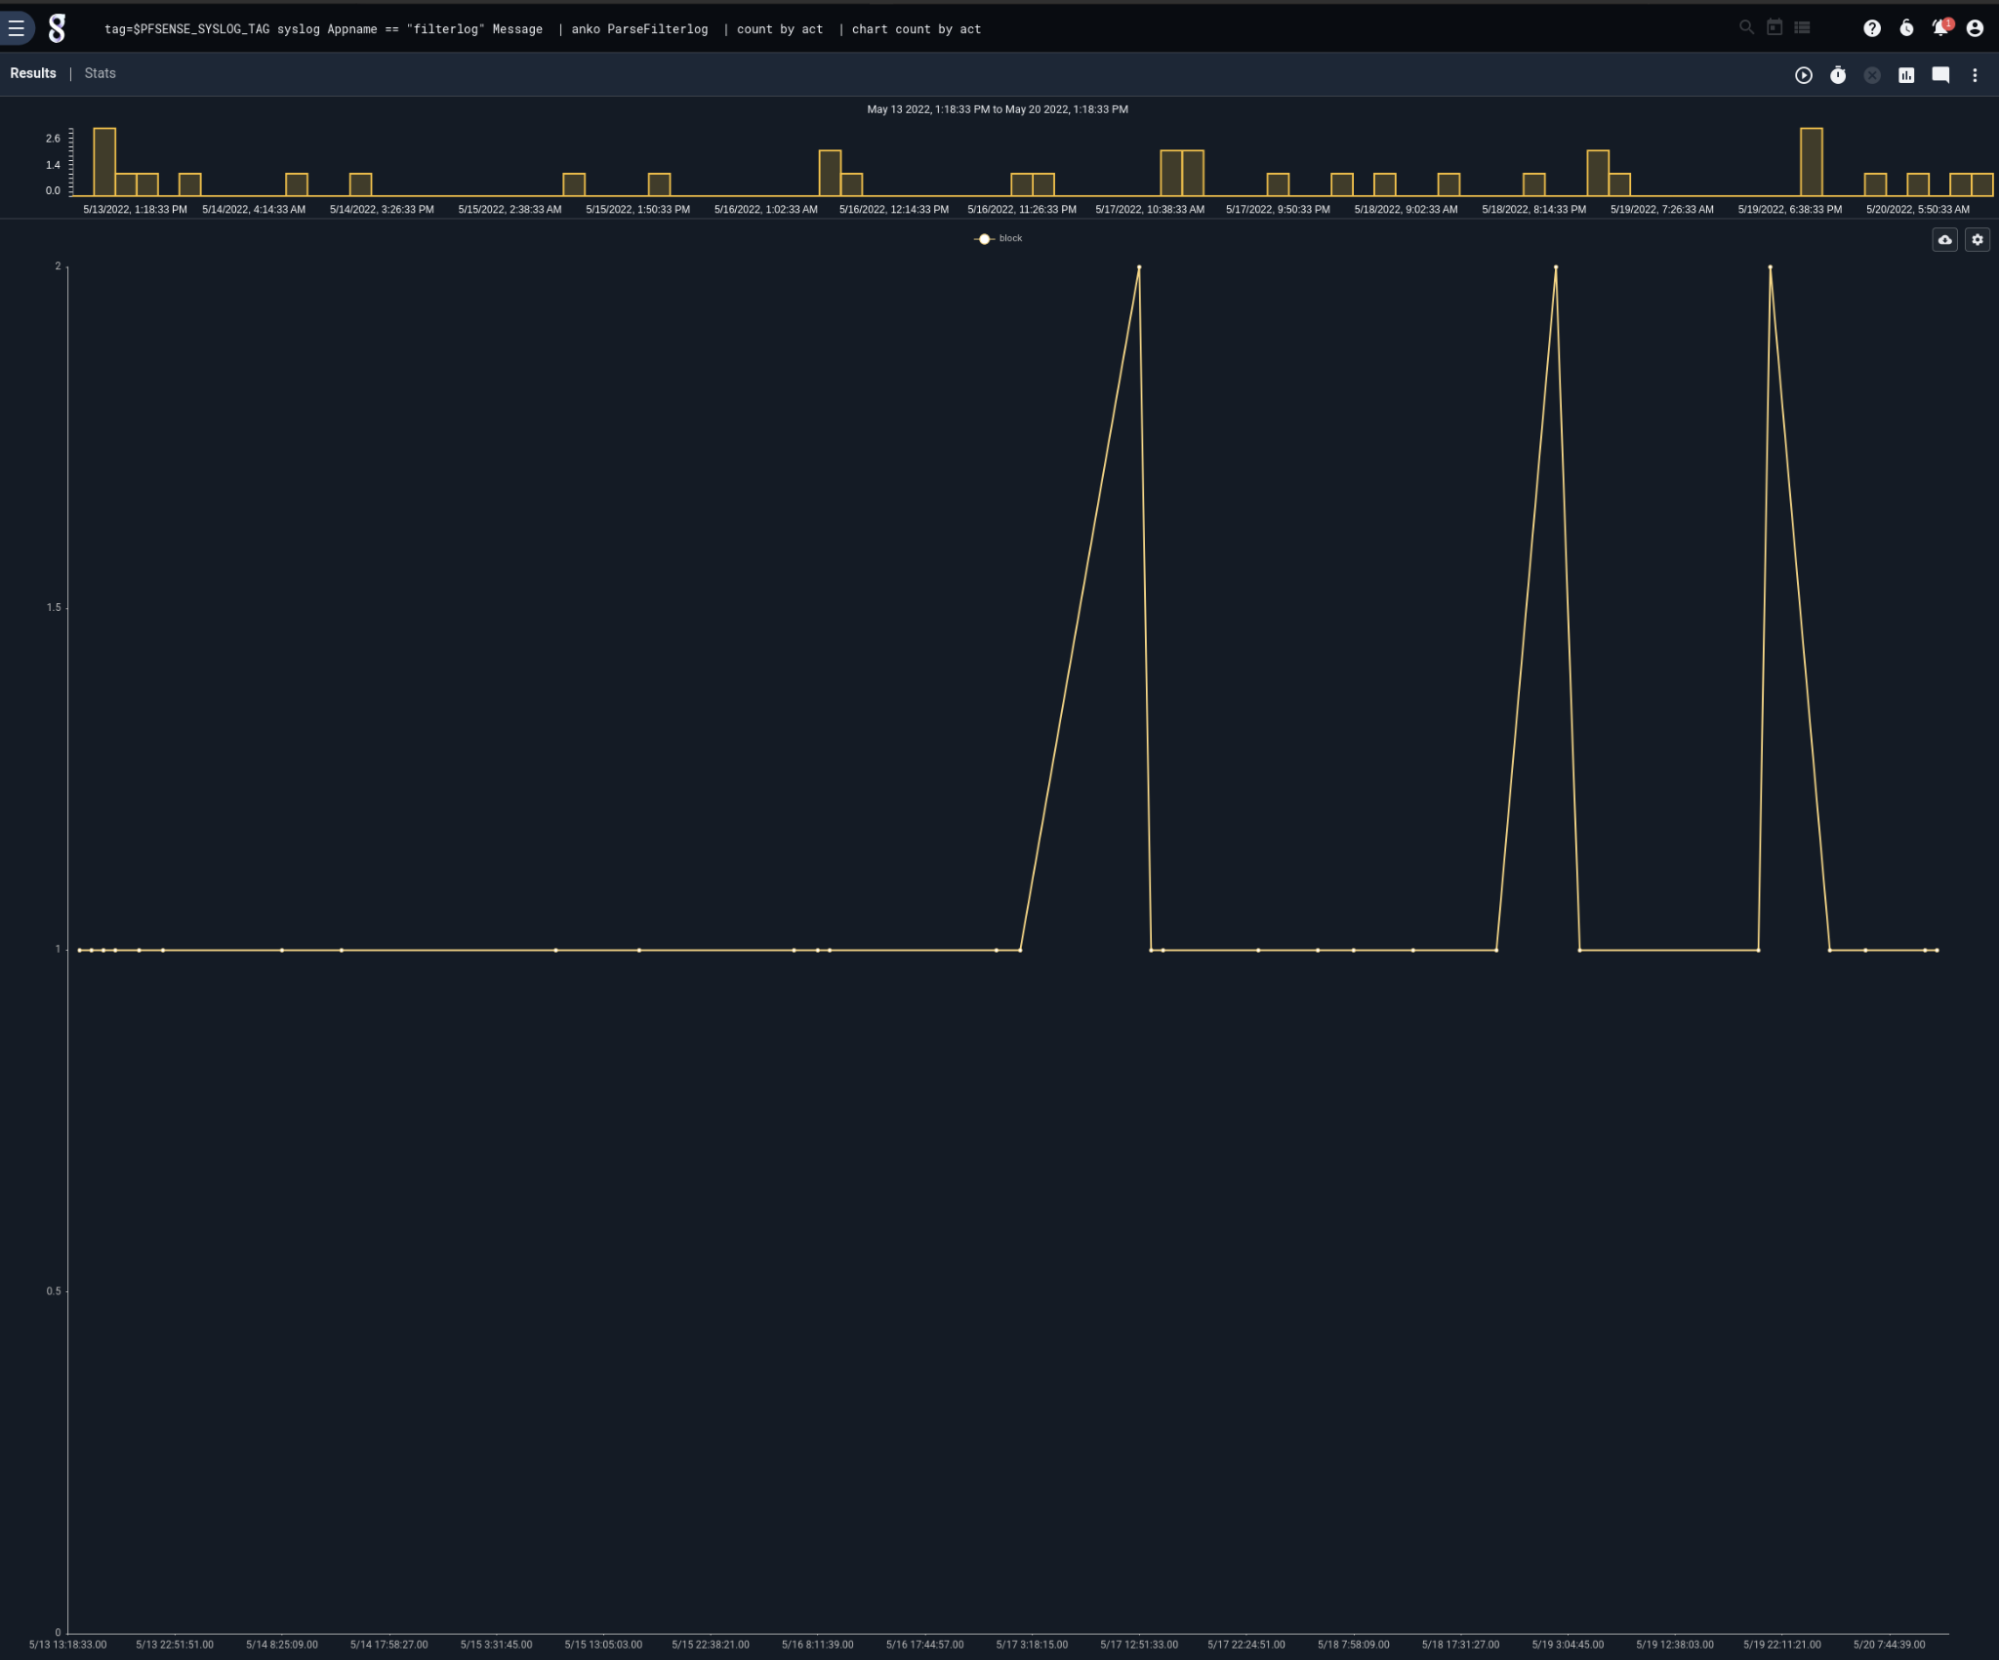
For more examples, have a look at the included query library and dashboards. The kit includes a number of firewall-specific tools for exploring and investigating firewall events. Perhaps one might want to see a quick plot of firewall actions taken over time. The Actions from pfSense® Firewall saved query does just the trick:
Or maybe a summary of firewall actions over the last week (featuring geolocated IPs!)
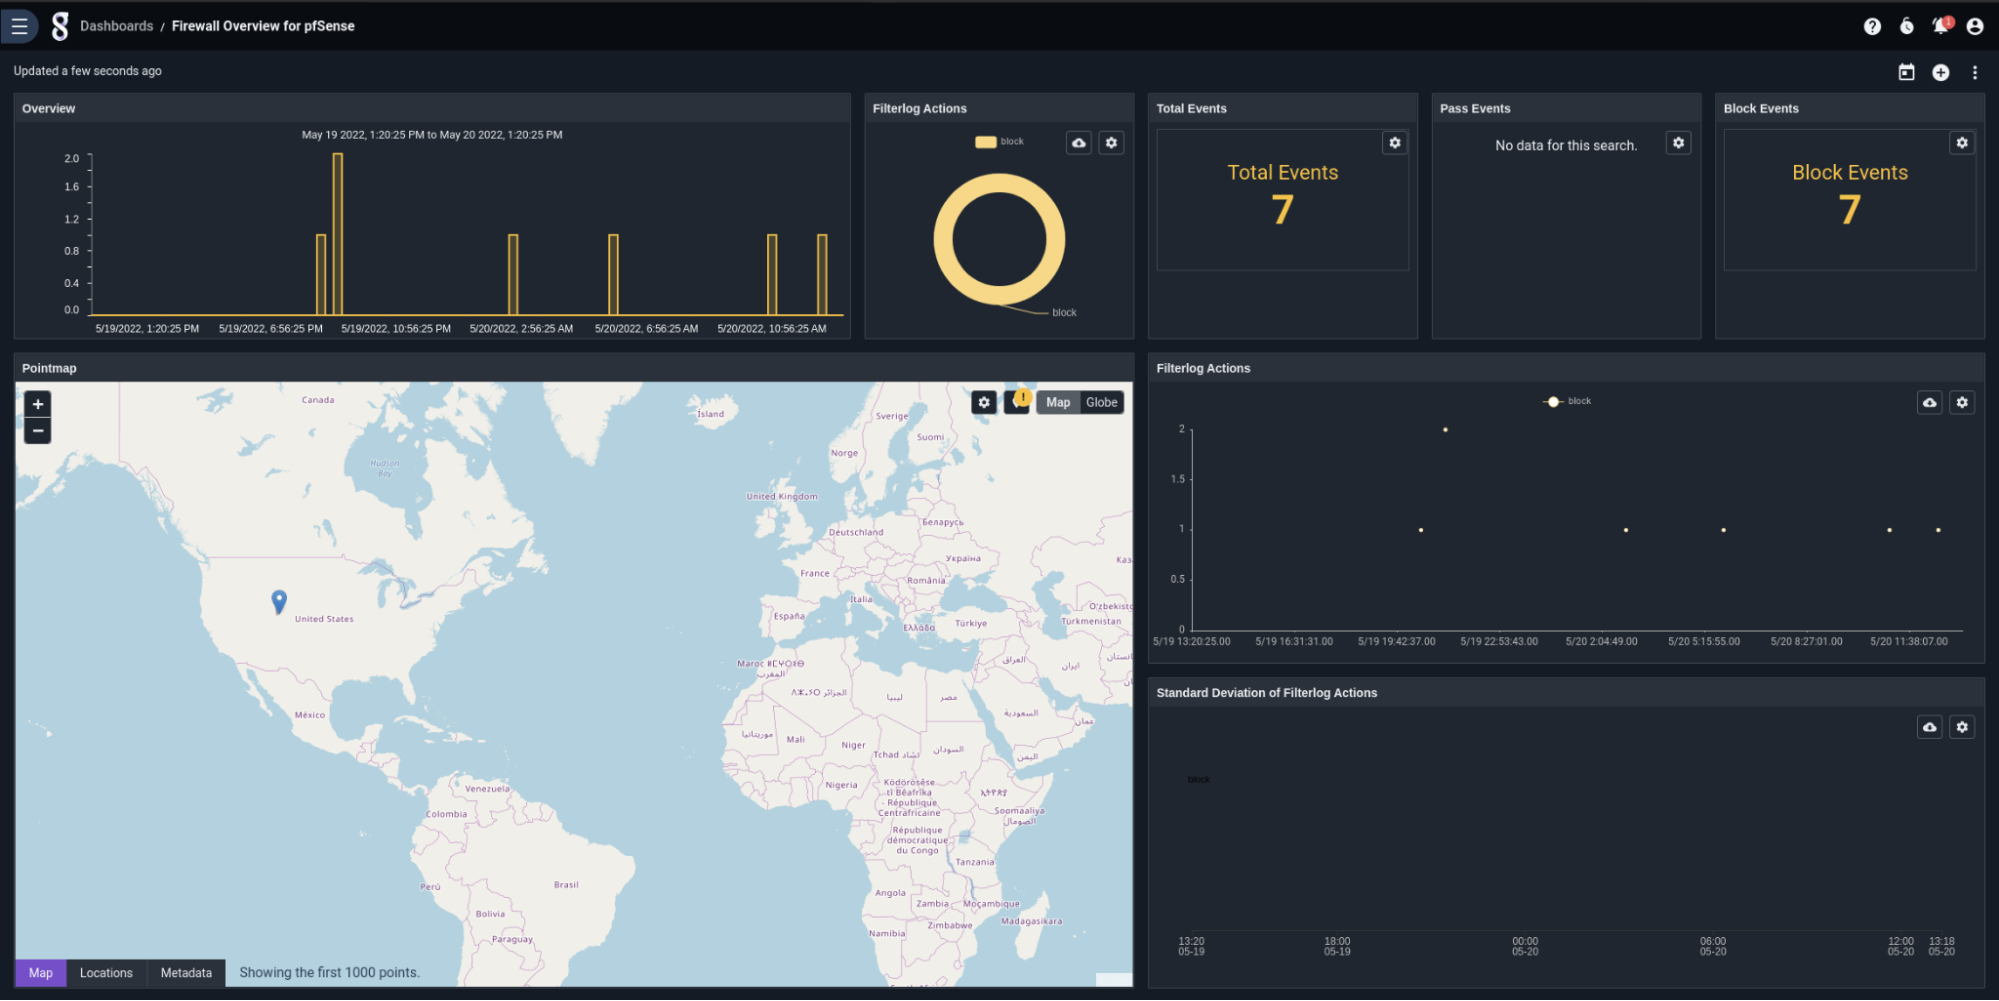
Find a suspicious IP you’d like to know more about? An included actionable makes it easy to pivot to investigative dashboards to have a closer look.
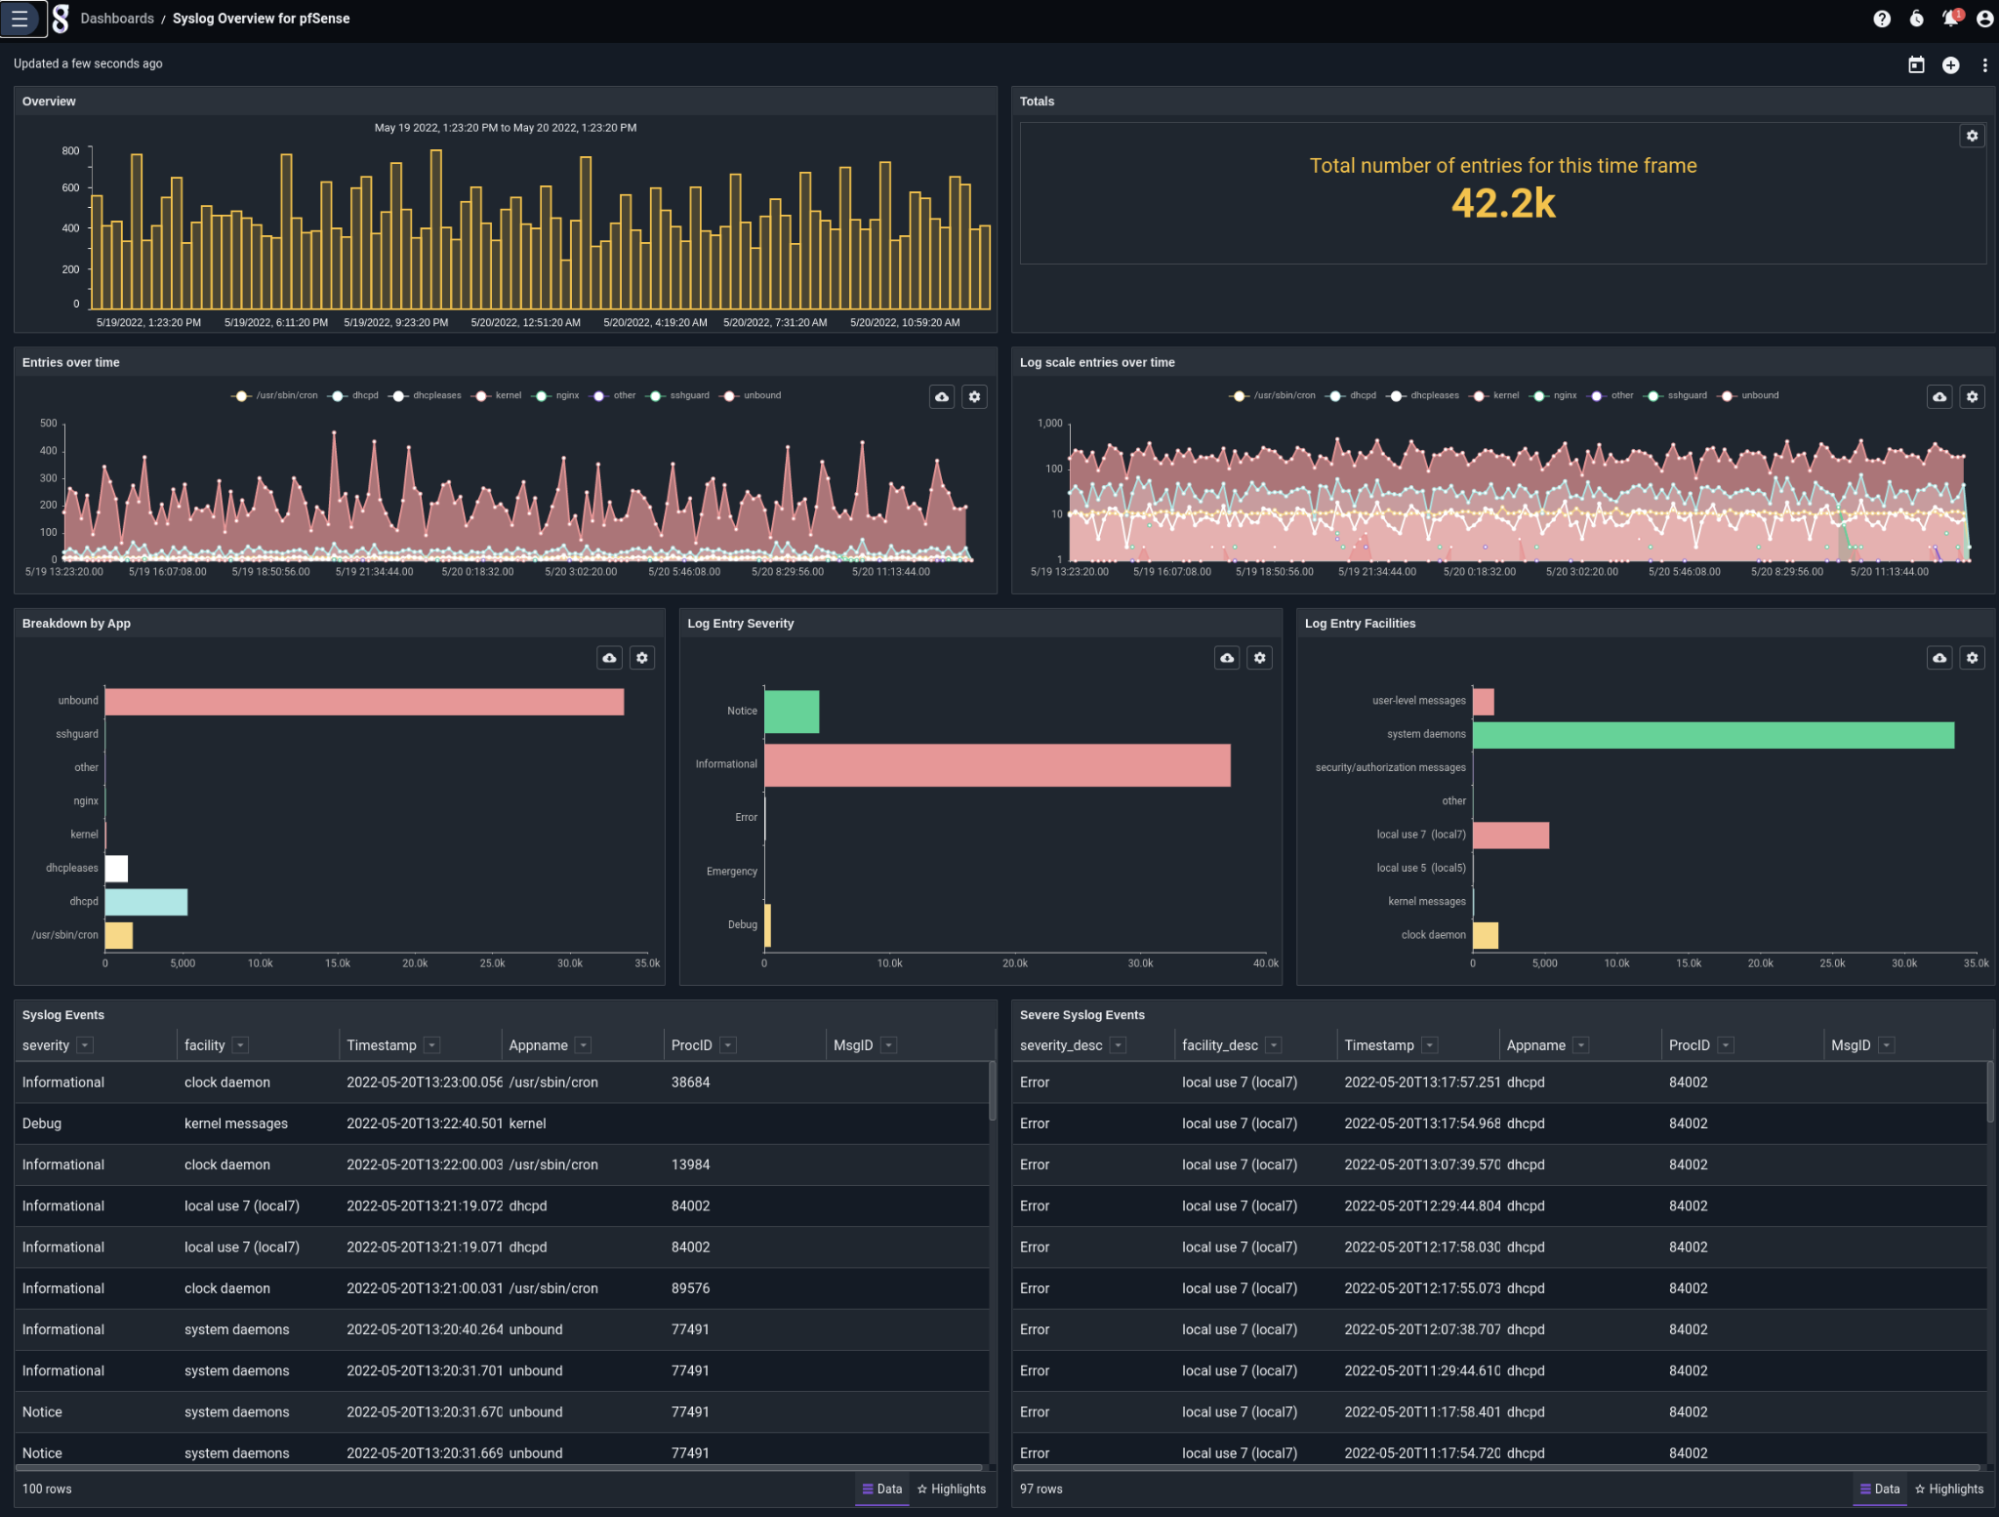
Or perhaps your firewall is quiet and you’d like to see what else your pfSense® instance is doing. There’s a dashboard with an overview of syslog activity, as well!
Conclusion
Install and try the new kit for pfSense® software inside Gravwell Enterprise and Community Edition today.
If you want to share what you built or have any questions, stop by our public Discord and chat with the team.