Overview
We are pleased to announce the immediate availability of Gravwell version 5.0.0 (codename Orion). This release marks a major milestone on our journey to simplify how users interact with logs, network data, and security events. We decided to name this new major release in honor of the constellation Orion. Everyone at Gravwell is betting on getting to see Betelgeuse go supernova in our lifetimes, so naming the release that we worked so hard on after it seemed fitting.
There are a few stars in this release, but the brightest has to be Flows. We have been working very hard to build an intuitive, tightly-integrated, and frankly gorgeous visual automation system. Flows allow users to visually design automations that query Gravwell, interact with external systems, export data, and even generate PDF reports. We also overhauled our systems and health interface, added an API token system, and then reworked the text and table renderers to make display of large quantities of data easier on us humans.
The API token system will be getting a dedicated post at a later date with a deep dive and some examples integrating Gravwell directly with other tooling. The Flows system is going to be getting a whole series of blog posts where we show you how to automate alerts, fetch external data, generate reports, build aggregates and metrics, and generally point and click your way to glory.
For this post we are going to do a quick 20,000 foot view of the new stuff and just generally show it off.
Flows
Flows are a visual programming interface that allows you to drag-and-drop your way to advanced automations. The system is well-integrated with Gravwell but can also pull data from other sources like HTTP endpoints, databases, or other data systems. This feature deserves a large series of posts, documentation, and videos (which it will get). Long story short, point, click, search orchestration and response.
Flows consist of nodes that can be wired together to accomplish tasks. For version 5.0.0 we hit all the high points: queries, some logic operators, formatters, and a smattering of output nodes. Future versions will have direct integrations with ticketing systems and even a Javascript interpreter.

While flows do make automations significantly easier, its still a "programming" system. So we made sure to build out a robust debugging and introspection system so that you can see data payloads flowing from one node to another. This makes designing and debugging complicated automation flows much more approachable.
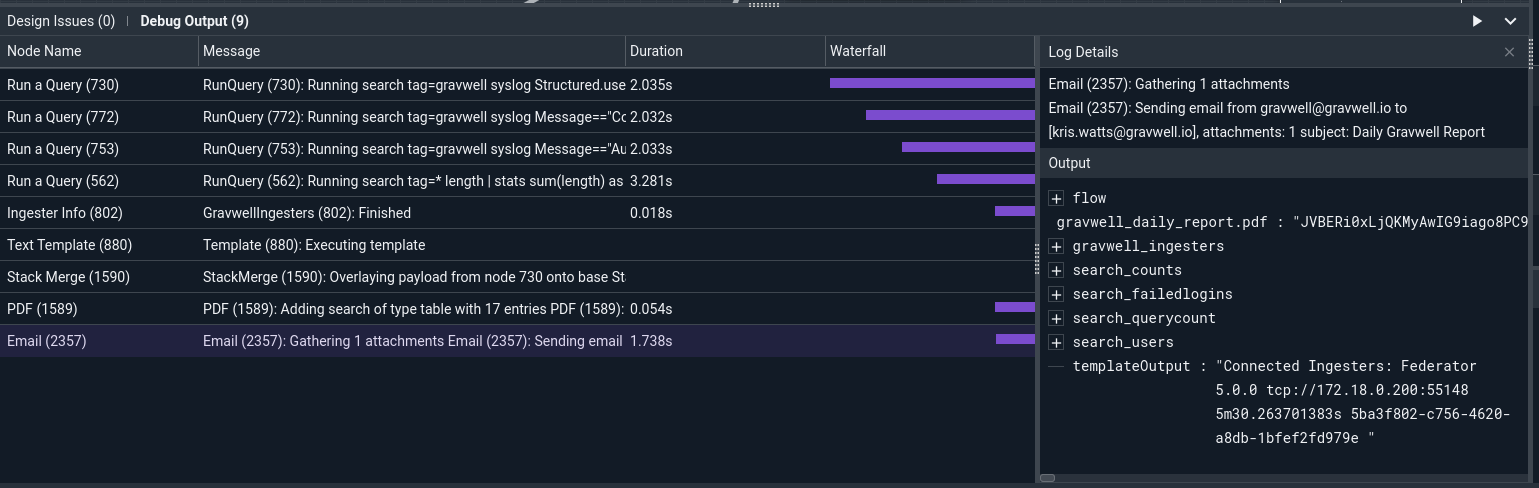
As a final tease, here is a flow that runs a few queries, hits the ingesters status API, generates a PDF, then sends an email with the PDF attached and uploads the PDF to Slack.
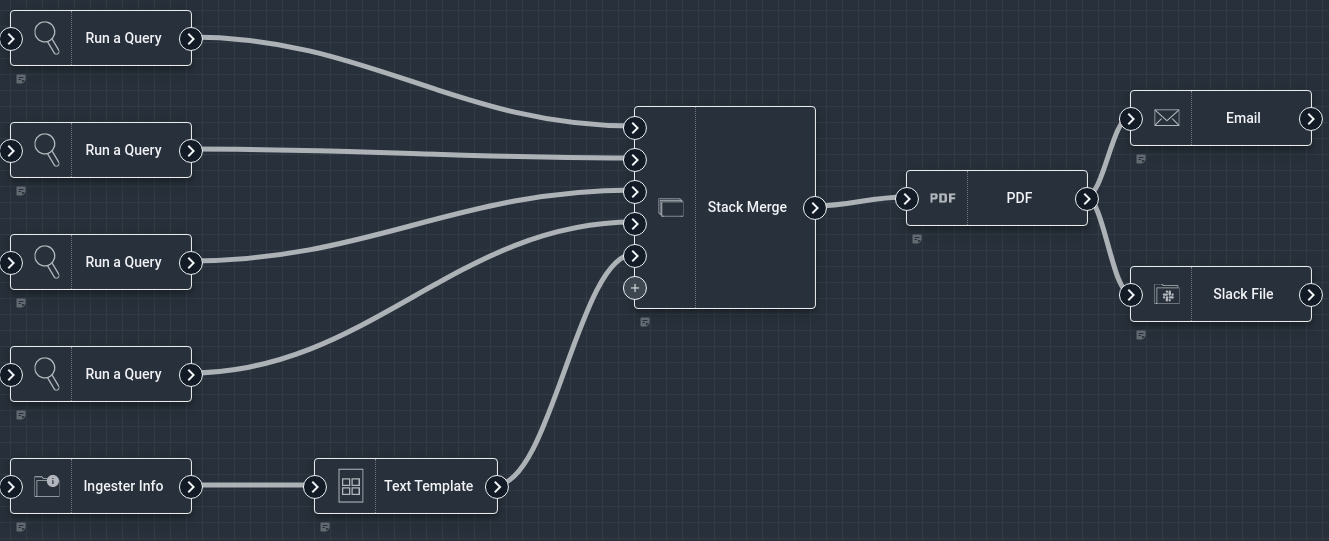
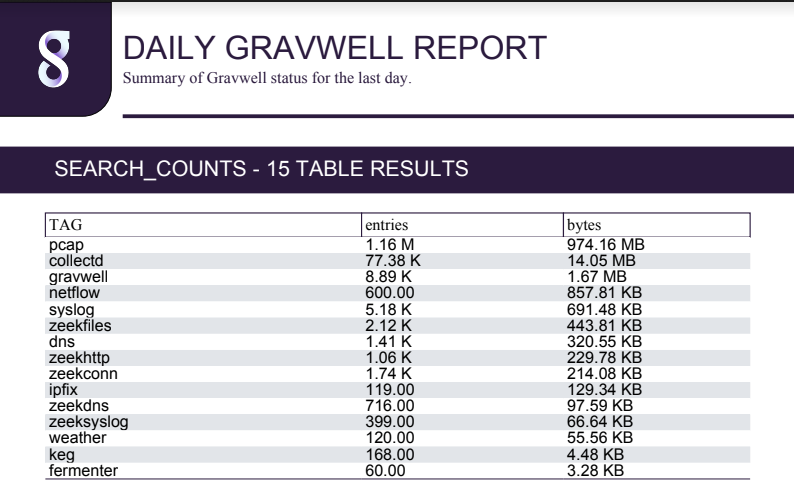
The output is a clean, well formatted PDF containing several query results and a status report on our ingesters.

Systems And Health
The old Gravwell Systems and Health interface made it a point to try and display as much info as possible about how a Gravwell cluster was behaving. This included hardware info, storage health, ingester activity, and general connectivity. However, because Gravwell supports a fully federated ingest system (most of our ingesters are open source and liberally licensed under the BSD 2-clause license), we had a bit of a blind spot in how we showed ingester connectivity. This is because ingesters can sit behind other ingesters (i.e. the Federator), and because some customers were rolling custom ingesters. As a result it could be difficult to determine exactly how an ingester was connected without digging into logs. To solve this issue and others, we overhauled the whole interface and added some useful visualizations to make it easier to figure out how things are behaving.
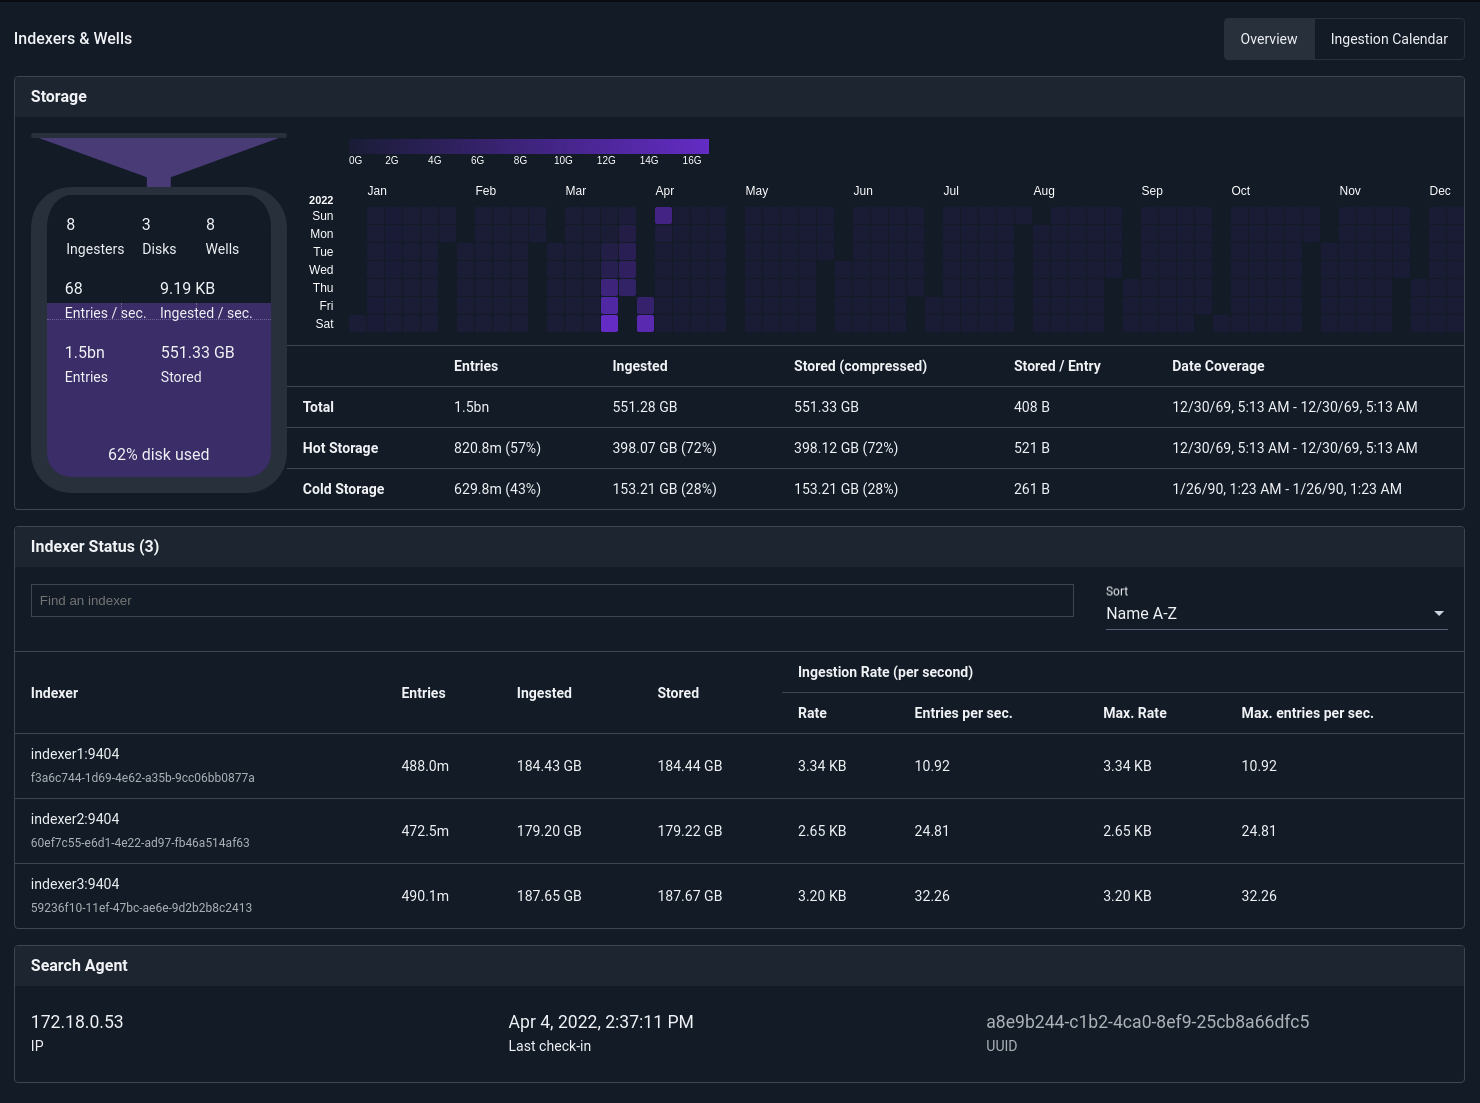
Above is the overview system which shows some basic health status and ingest rates. Below you can see the overall data ingest rate, number of indexers, status of the search agent, and a basic ingestion calendar.
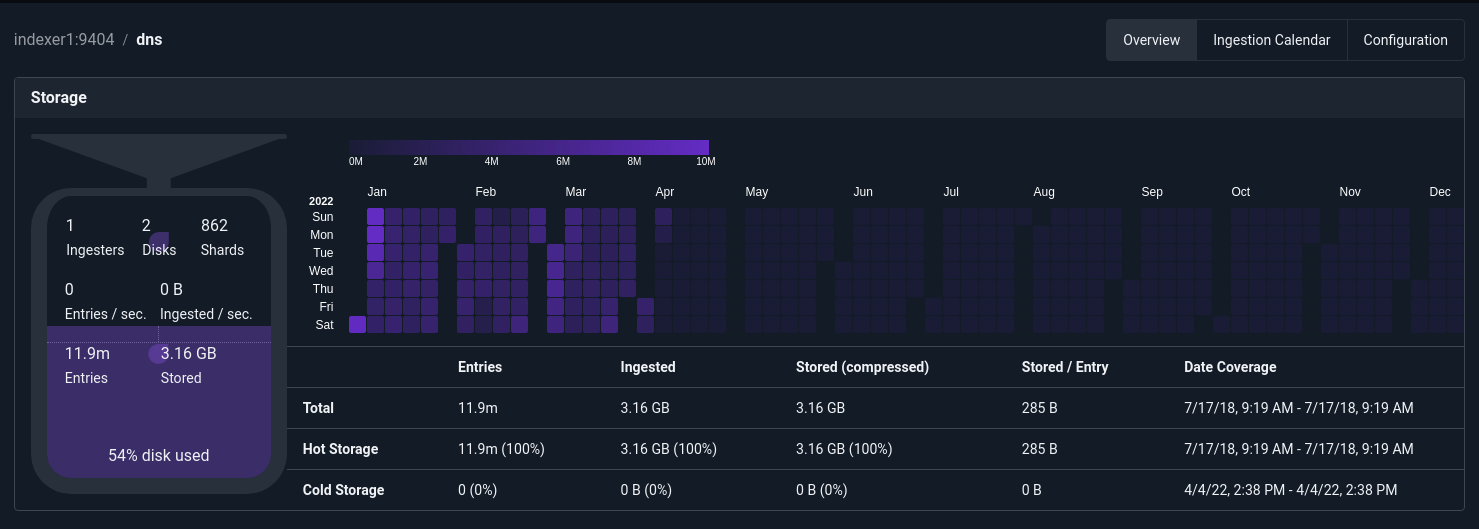
Using this view you can very quickly eye-ball how much data is coming in, how much you have stored, and how much headroom an entire cluster has in terms of storage. The ingestion calendar shows a rough magnitude of current data for the current year. Clicking on the ingestion calendar allows for seeing basic data storage metrics across the entire storage history. You can filter by wells and as well to see which data chunks are consuming the most and where they sit on a timeline.

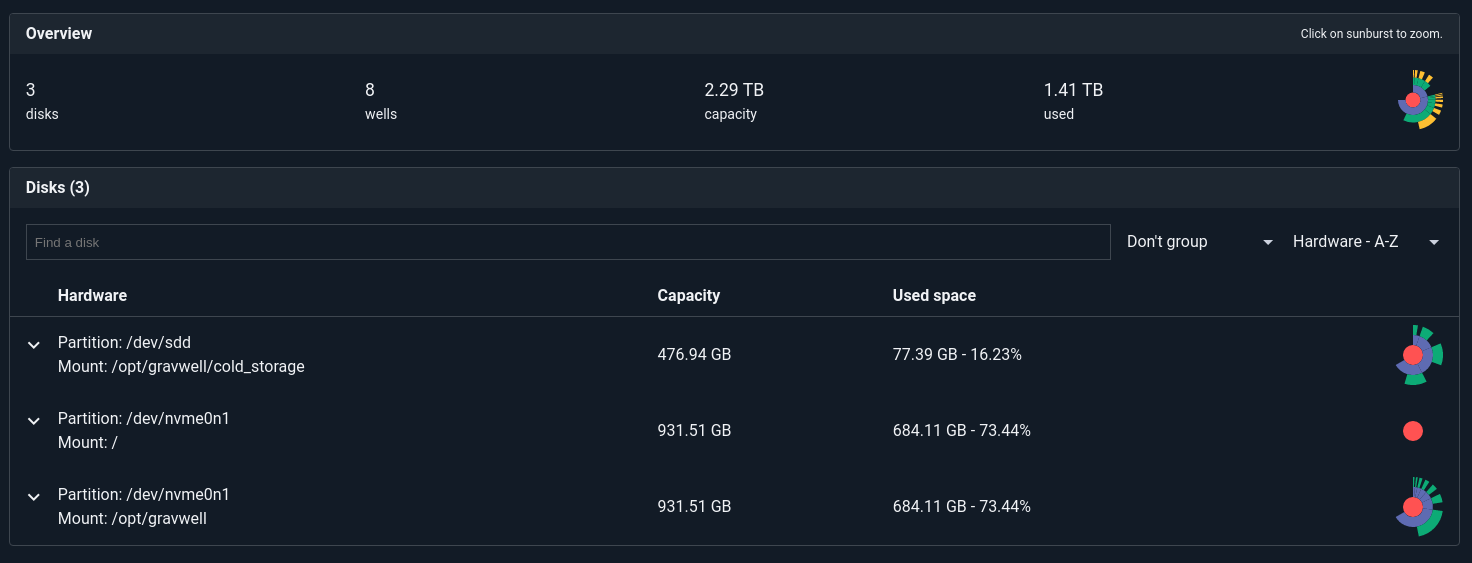
The new disk overview page also shows you all the disks Gravwell is actively using and provides a nice little sunburst chart of how those disks are being used.
The view that really helps dig into the status of a running Gravwell instance is the overhauled ingester list. This new view does away with the simplistic listing of connections and instead categorizes and deduplicates ingesters. Using this view you can see the unique set of ingesters (regardless of how they are connected to your indexers) and their UUIDs, versions, uptime, tag counts, and whether they are directly connected to indexers or are connected through a federator.

This view also groups by ingester type; in this case, you can see that we have a few File Follower and Simple Relay ingesters with differing versions. Clicking on the upgrade button will take you to the download page for an updated version of ingester–don't worry, we aren't going to be pushing any code out to your infrastructure through some spooky proprietary deployment framework.
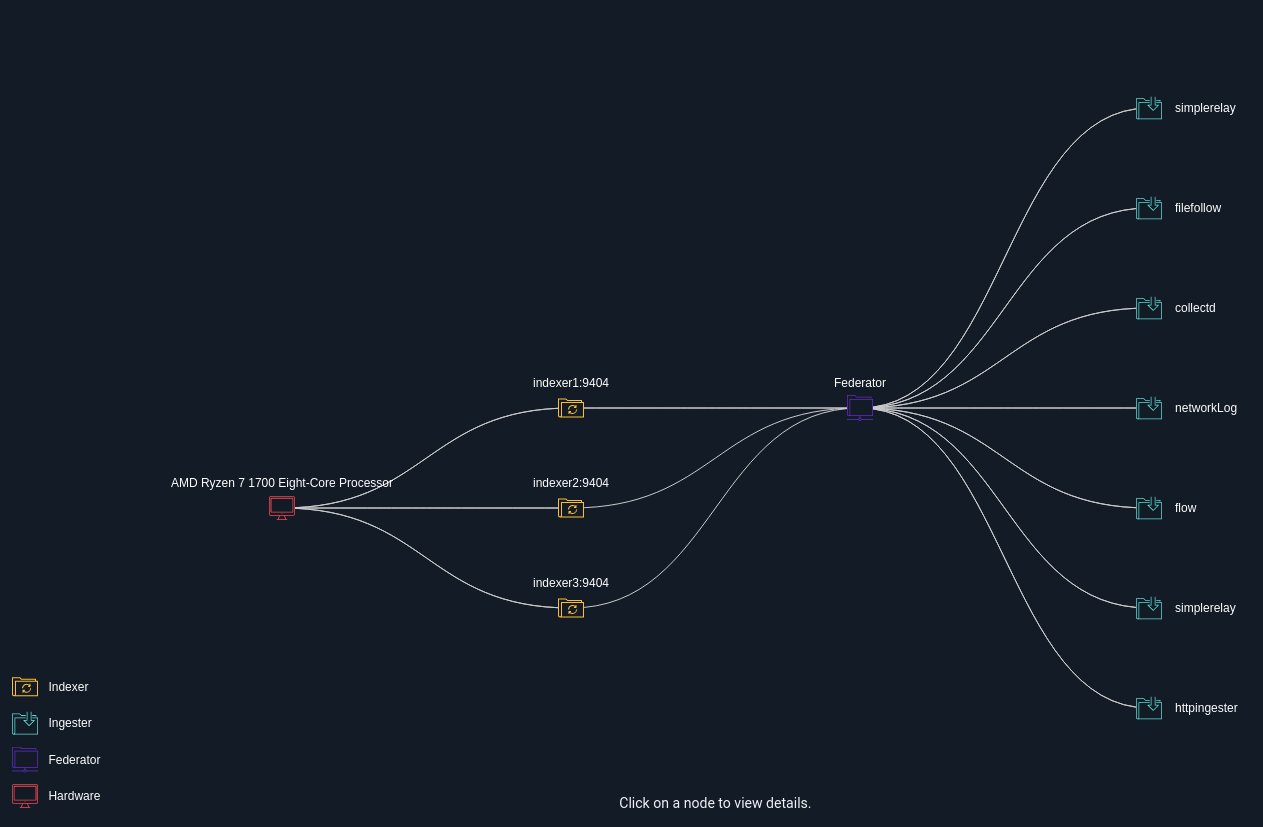
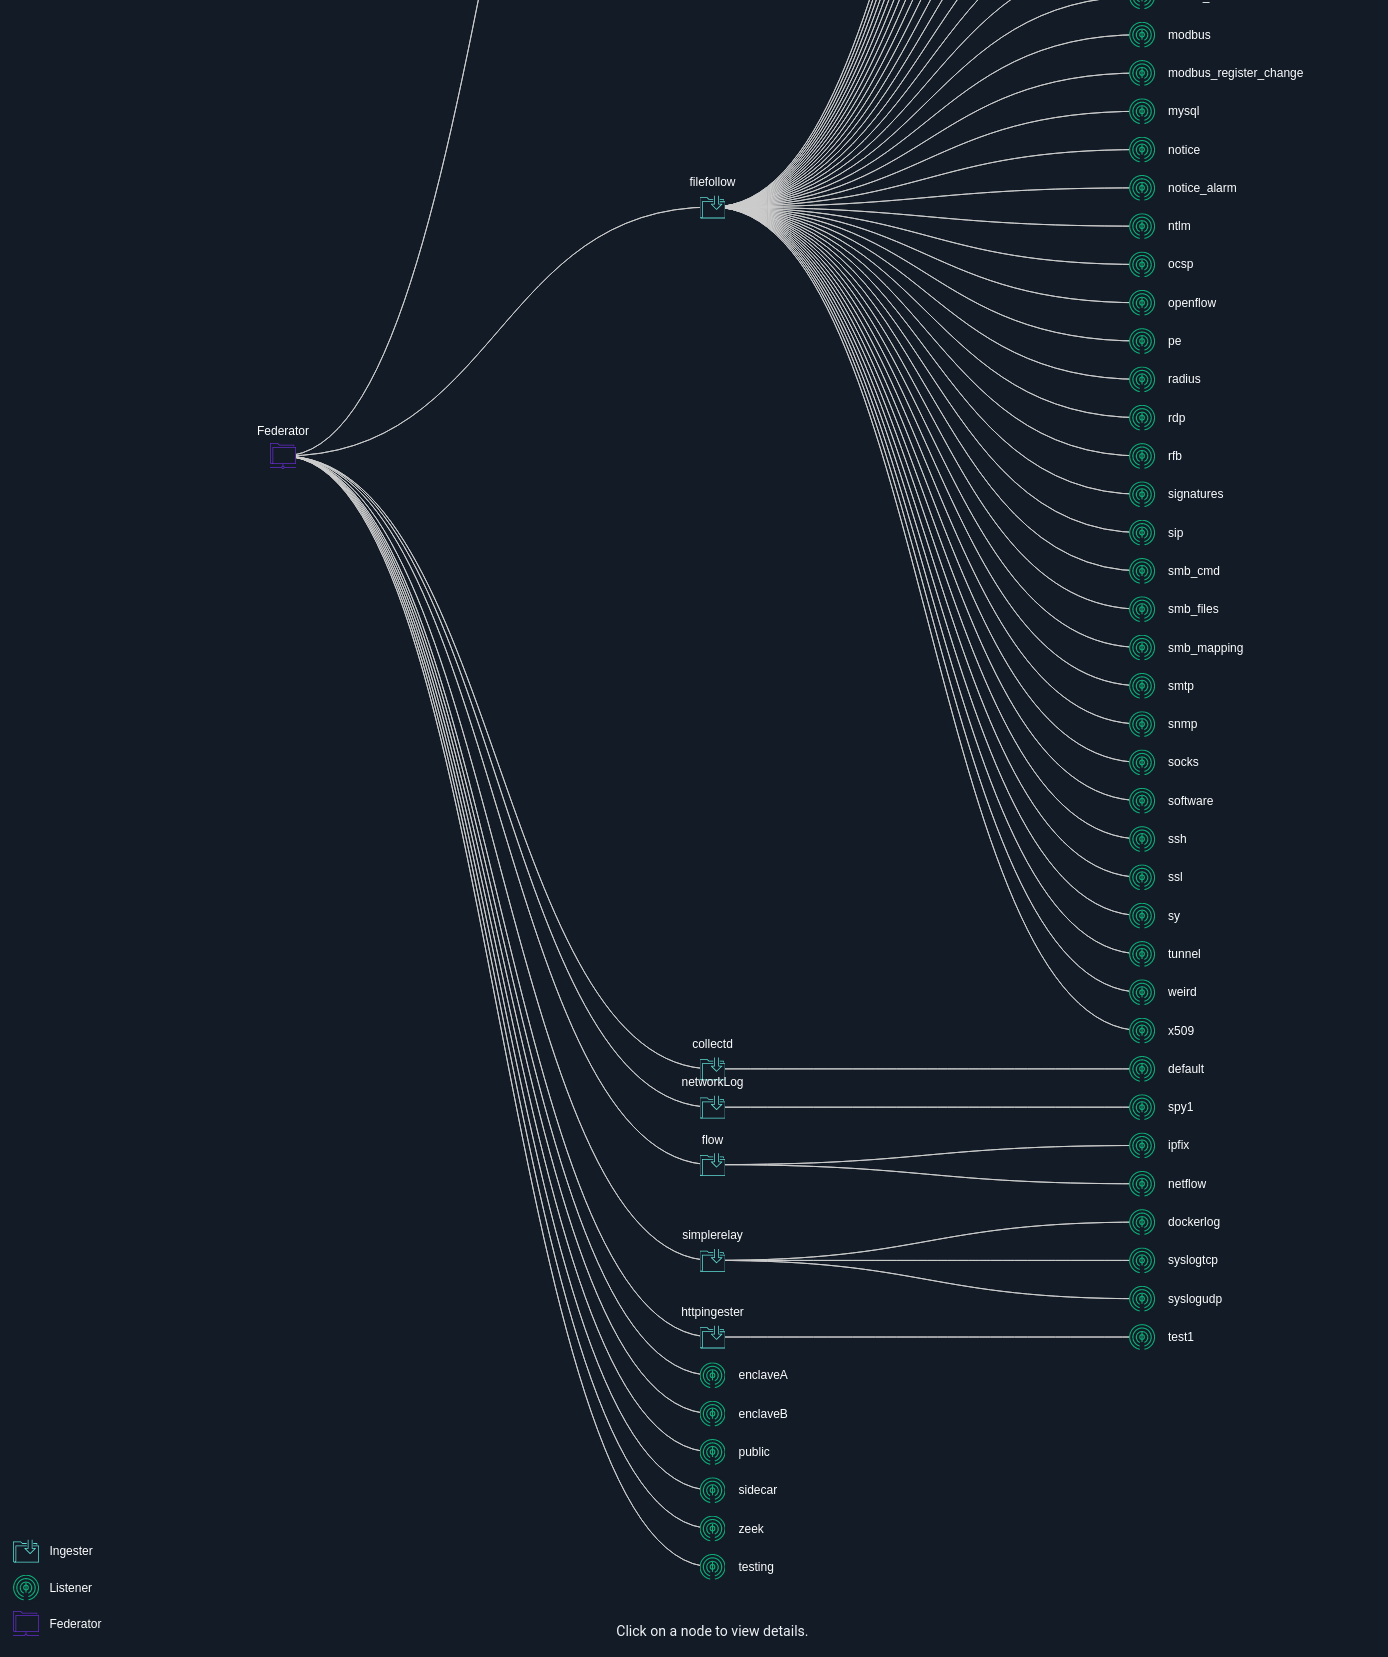
The screenshot below shows one of the most exciting new features in the Systems page: the ingester topology graph. It lays out the structure of your entire Gravwell cluster from the webserver down to the ingesters. In this case, you can see 7 ingesters all feeding entries through a single Federator, which multiplexes data out to 3 indexers.
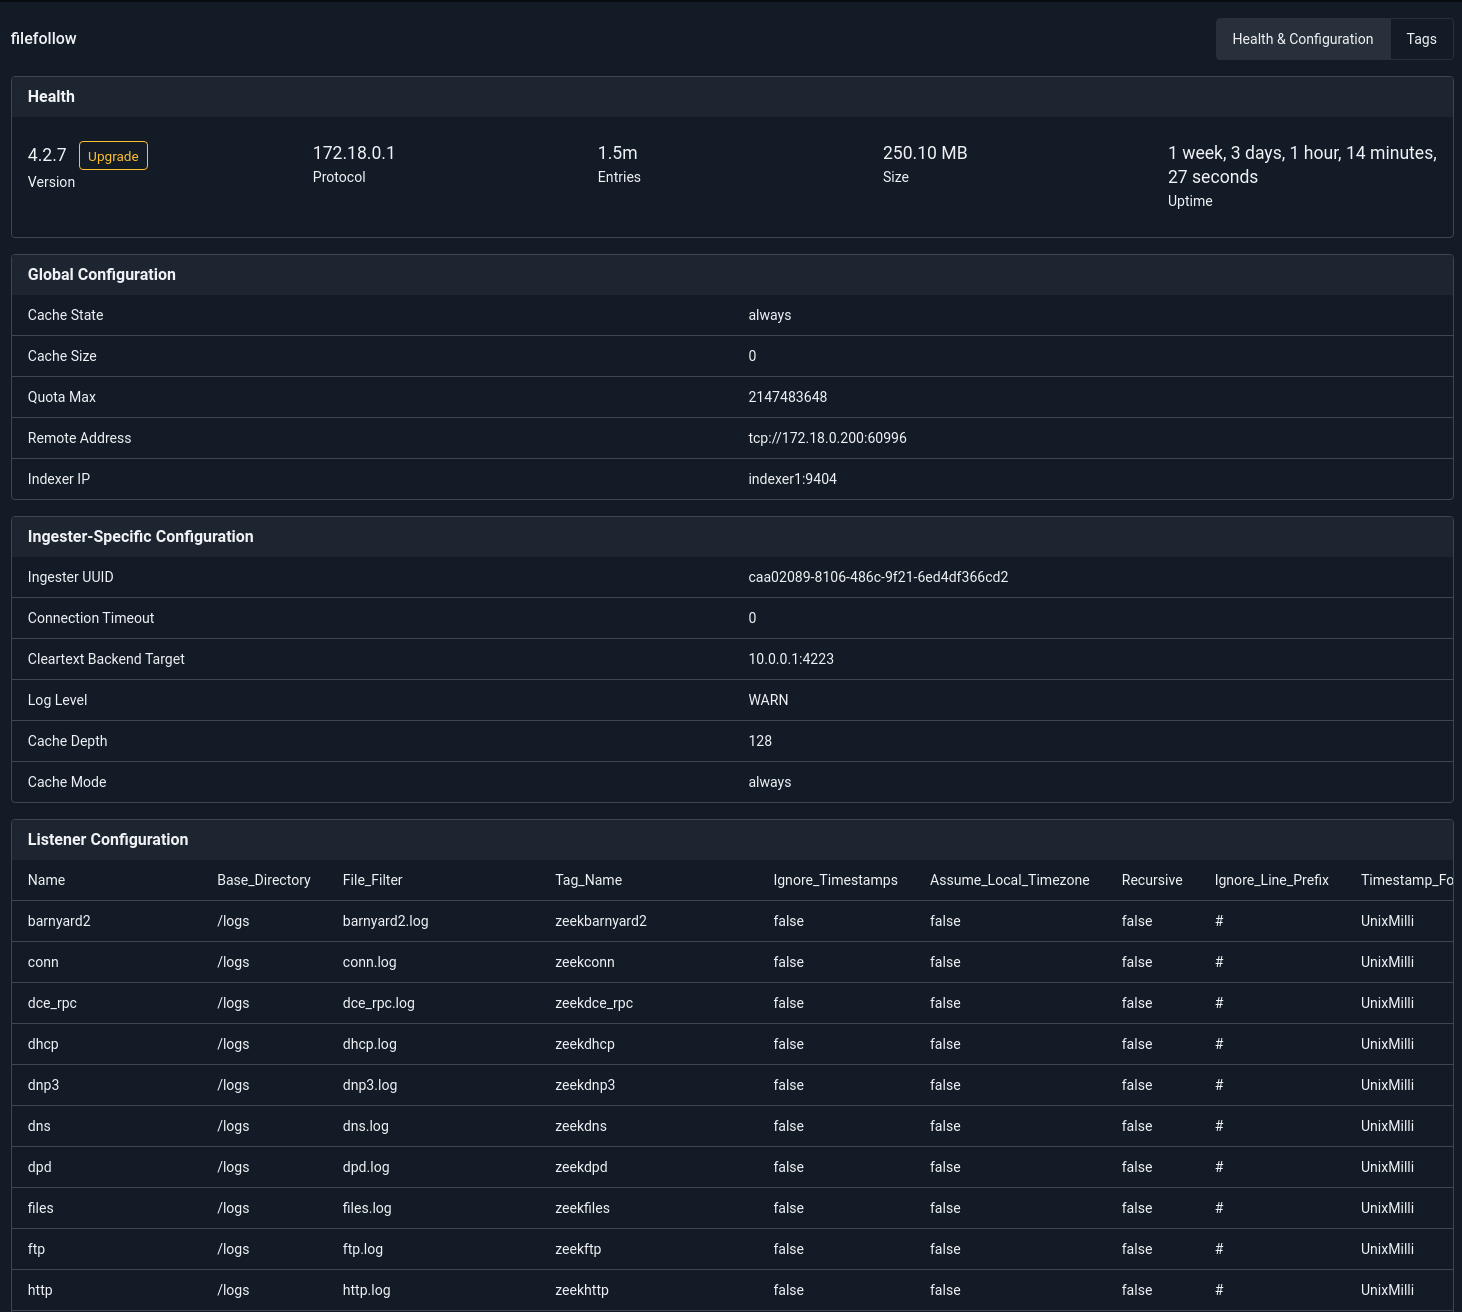
You can also click on any of these ingesters and get a dump of its configuration and any downstream data sources they may be listening to. Here you can see my file follower that is consuming from a Zeek system; it shows some configuration data, cache state and many of the Zeek listener configurations that are actively attached to and feeding from Zeek data.
The topology view can also show listeners and downstream data sources in a visual way. The screenshot below shows the same Gravwell cluster, but with display of indexers and webservers disabled. You can see that the Zeek file follower is tracking a great number of files, so many in fact that the full graph can't fit on one screen!

API Tokens
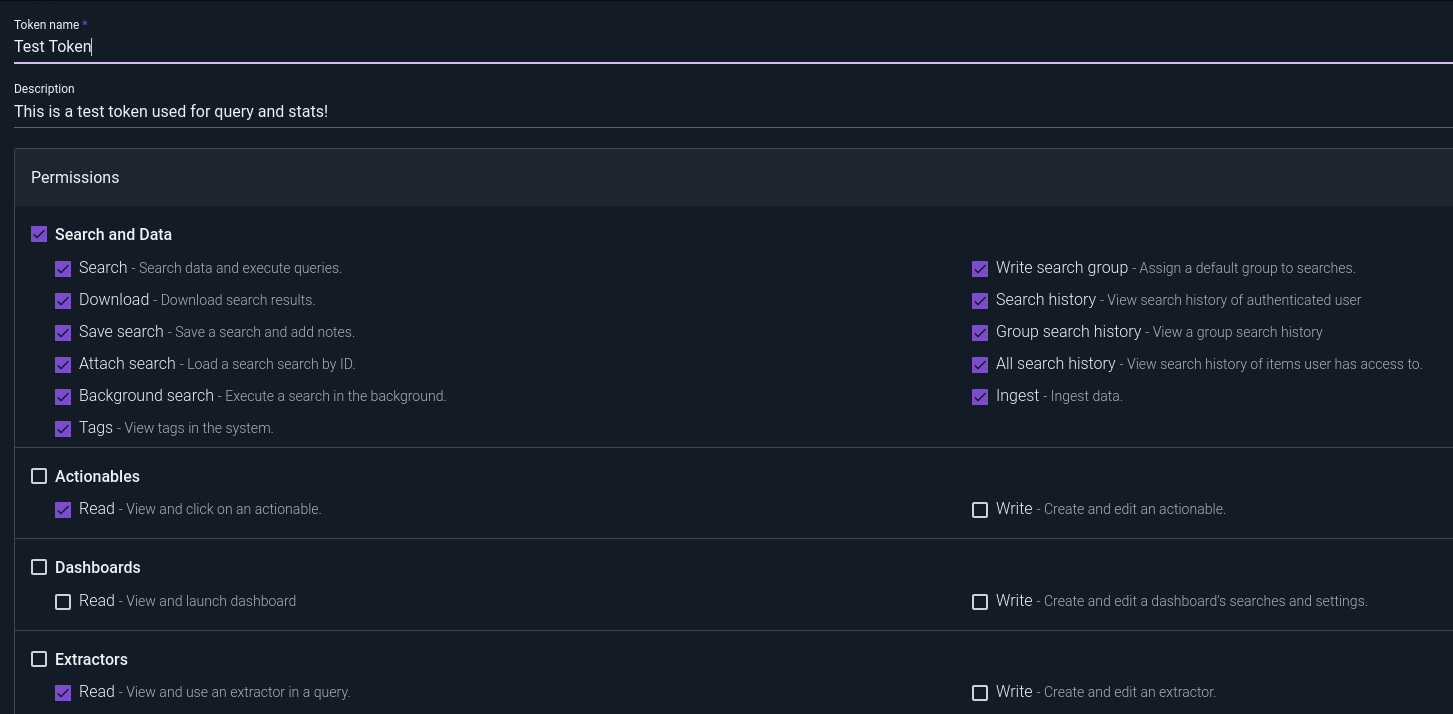
The Gravwell API Tokens system is one of those "wow, how did we ever get by without this?" features. Basically, Gravwell lets you generate unique tokens that can access specific functionalities without walking the entire login dance. Combine the tokens with the new direct query API (https://docs.gravwell.io/#!search/directquery/directquery.md) and you can now perform an entire Gravwell query with a single HTTP request, making it exceptionally easy to feed data from Gravwell to outside tools like PowerBI or a database. Have curl, will travel!
-H "Gravwell-Token: APITOKEN" \
-H "query: tag=gravwell syslog Appname | stats count by Appname | table" \
-H "duration: 1h" \
-H "format: csv" \
http://10.0.0.1/api/search/direct
Better Tables and Data Displays
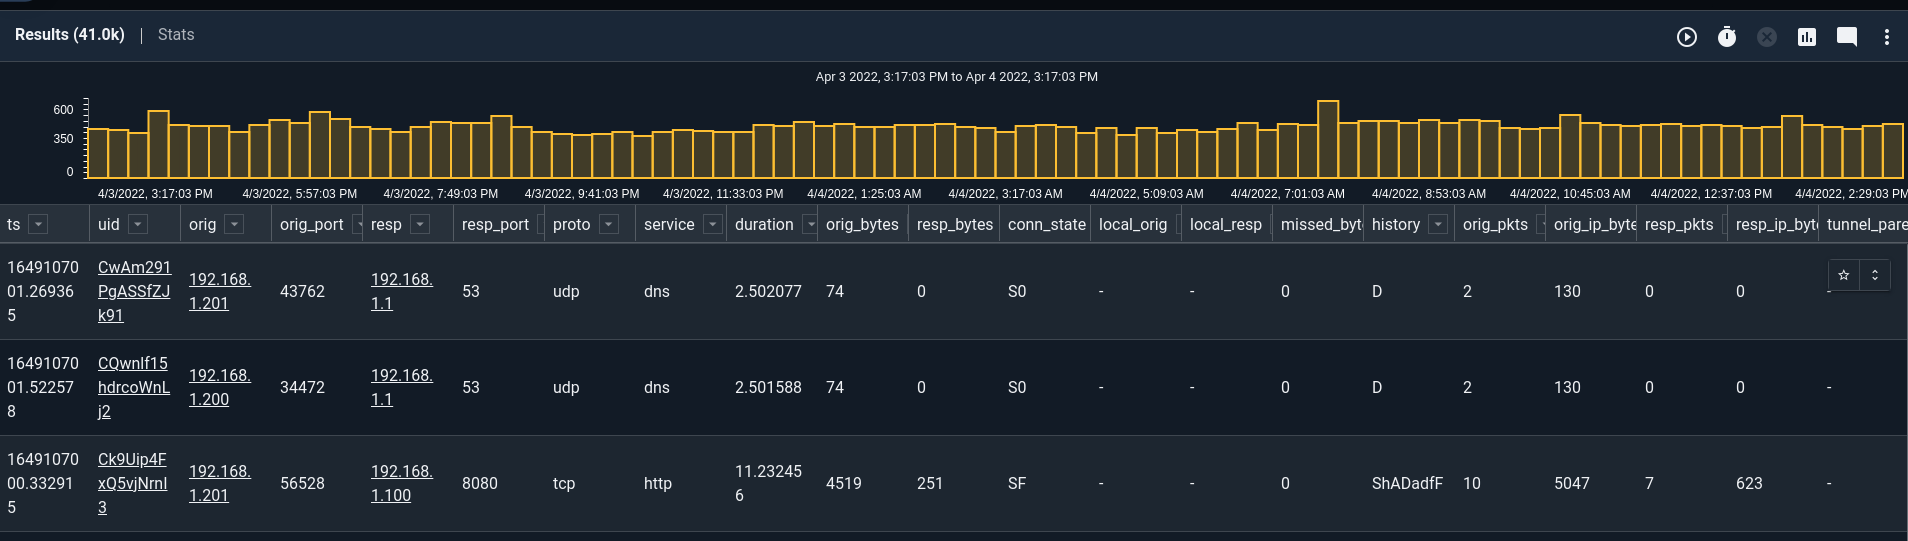
Versions of Gravwell prior to version 5.0.0 could often struggle with tables that had many columns; columns would end up squished and hard to read. We revamped our table and text renderers to not only size better but also allow for some cool selection tools. Here you can see a table generated from a zeekconn log; it has a ton of columns that don't really fit on the screen. The new table sizes in a much more sane way and adds scroll bars:
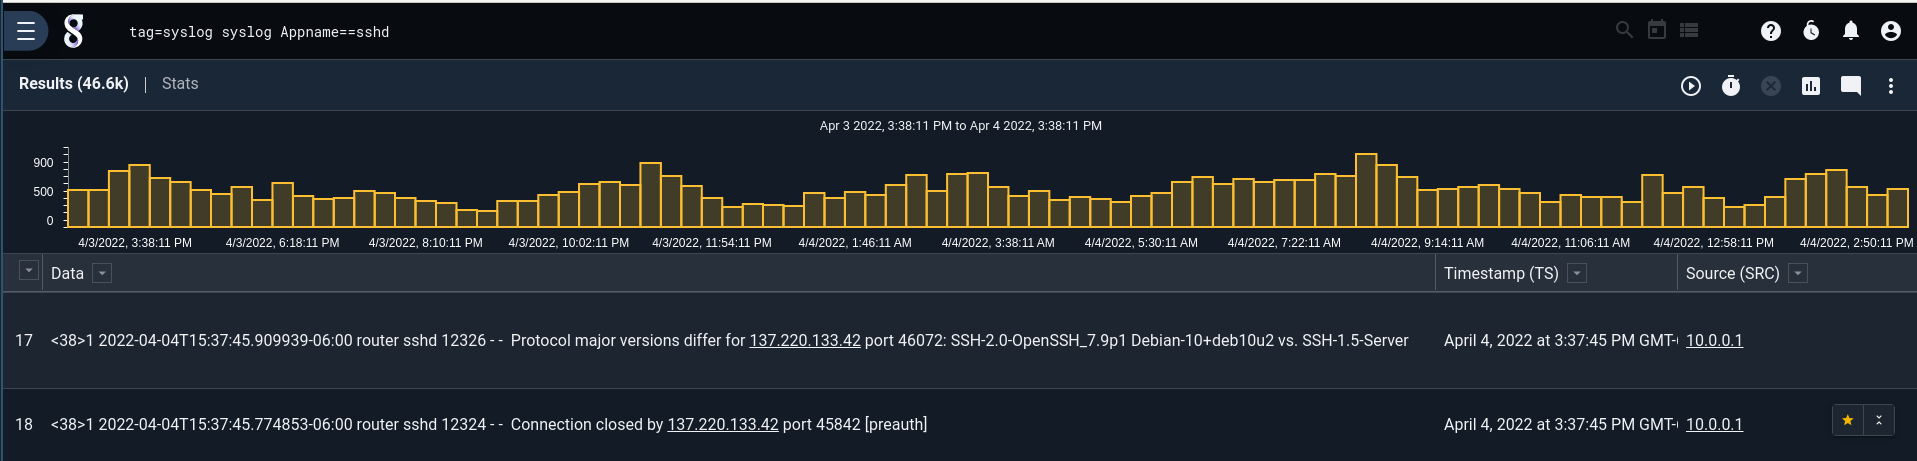
The text renderer now lets you highlight rows of data and quickly pivot into a view with only those highlighted rows. This makes working through raw logs much easier as you can pick out just a few entries you're interested in and look at them together without having to refine your query.
Conclusion
Gravwell provides immense power over logs and binary data. You can twist and turn everything from Unix syslog to Windows XML logs, Zeek logs to IPFix to raw packets. This release marks another step (giant leap, perhaps?) on our journey to making your investigations more convenient and flexible. Flows take the code out of automation. Our new systems page makes visually assessing system health easier. API tokens just get out of the way and let you hit the search system with whatever tools you prefer–to be honest, we were surprised by how many people have asked, "that's a fancy GUI and all, but can I just drive it with curl?" Now we can proudly say: yes!
Gravwell 5.0.0 has a ton of new features to simplify how you interact with your data, and with our unlimited pricing you won't pay by the byte or by the query. We hate watching people not use the tools at their disposal or spend valuable human time deciding what gets thrown on the floor due to a pay-by-the-drip licensing model. Gravwell does not charge by the byte and we don't limit how many actions or automations you can perform, because better actionability is worthless if you can't afford to store the data or actually take action on it.

Conclusion to the Conclusion
I WILL get to see Betelgeuse explode with my own two eyes before I die. I DEMAND IT.