Some time back, I built a small, hydroponic garden in my garage to grow fresh veggies year round. Although I avoided a few hazards of traditional gardening, moving my garden inside proved to have its own set of challenges. I eventually realized that I could better manage my plants if I had a means to continually monitor their condition. Using an Arduino, a few sensors, and a tiny web server, I started collecting and accumulating data about my garden. It didn't take long before the amount of accumulated sensor data became cumbersome to look through. However, after importing the data into Gravwell, I was able to quickly visualize historical sensor information and gain new insights to make my thumb a little greener.
When I moved to Oklahoma a few years ago, I had high hopes of starting a backyard garden -- with fruits and veggies to share with friends and neighbors. I bought tools, seeds, gloves… the whole gamut. It wasn't long before I realized it gets really hot in Oklahoma ... and plants don't like red clay ... and there are tons of hungry grasshoppers around ... and the wind will blow away everything you love.
So, I gave up on gardening the old fashioned way and decided to try hydroponics instead.
Indoor Gardening with Hydroponics
Growing plants hydroponically essentially means your plants' roots grow in nutrient-rich water rather than soil. There are a number of ways to do it that vary in cost and complexity. After some quick research, I decided to build an ebb and flow system because it's low maintenance, and I'm lazy.
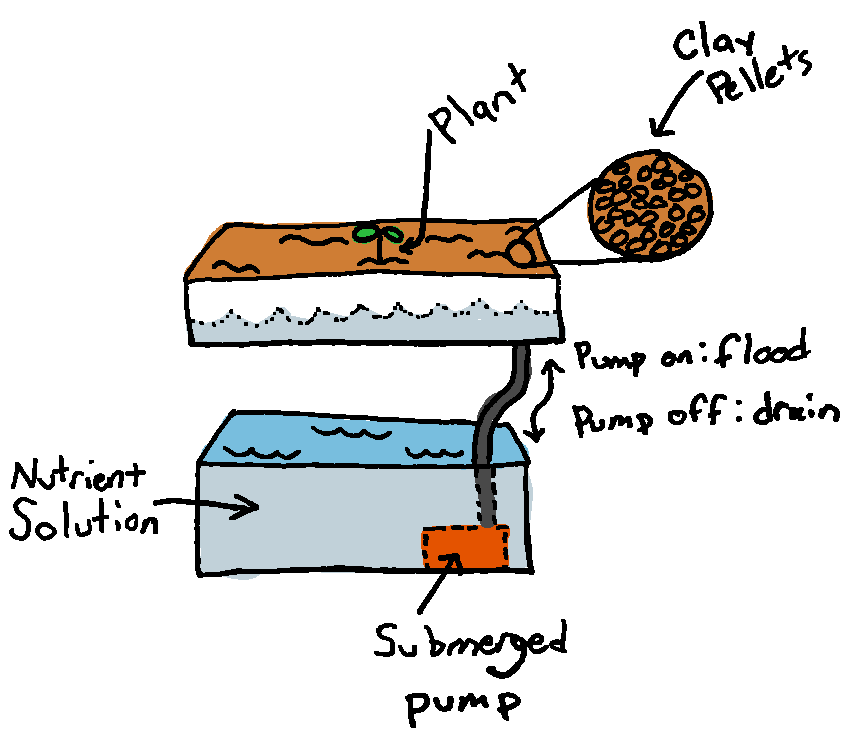
A basic ebb and flow system. Turn the pump on, the tray floods. Turn the pump off, the water drains back into the tank through the pump.
The basic idea is that the plants live in a big tray of clay pebbles, and periodically, a pump floods the tray with nutrient-rich water. The plants' roots absorb water/nutrients during the flood (the flow), and they can breathe the air when the water is low (the ebb). If you're ever in the St. Louis area, the St. Louis Science Center has a great aquaponics exhibit. It's the same idea, but rather than adding nutrients yourself, fish live in the water tank and... deposit... all the nutrients.
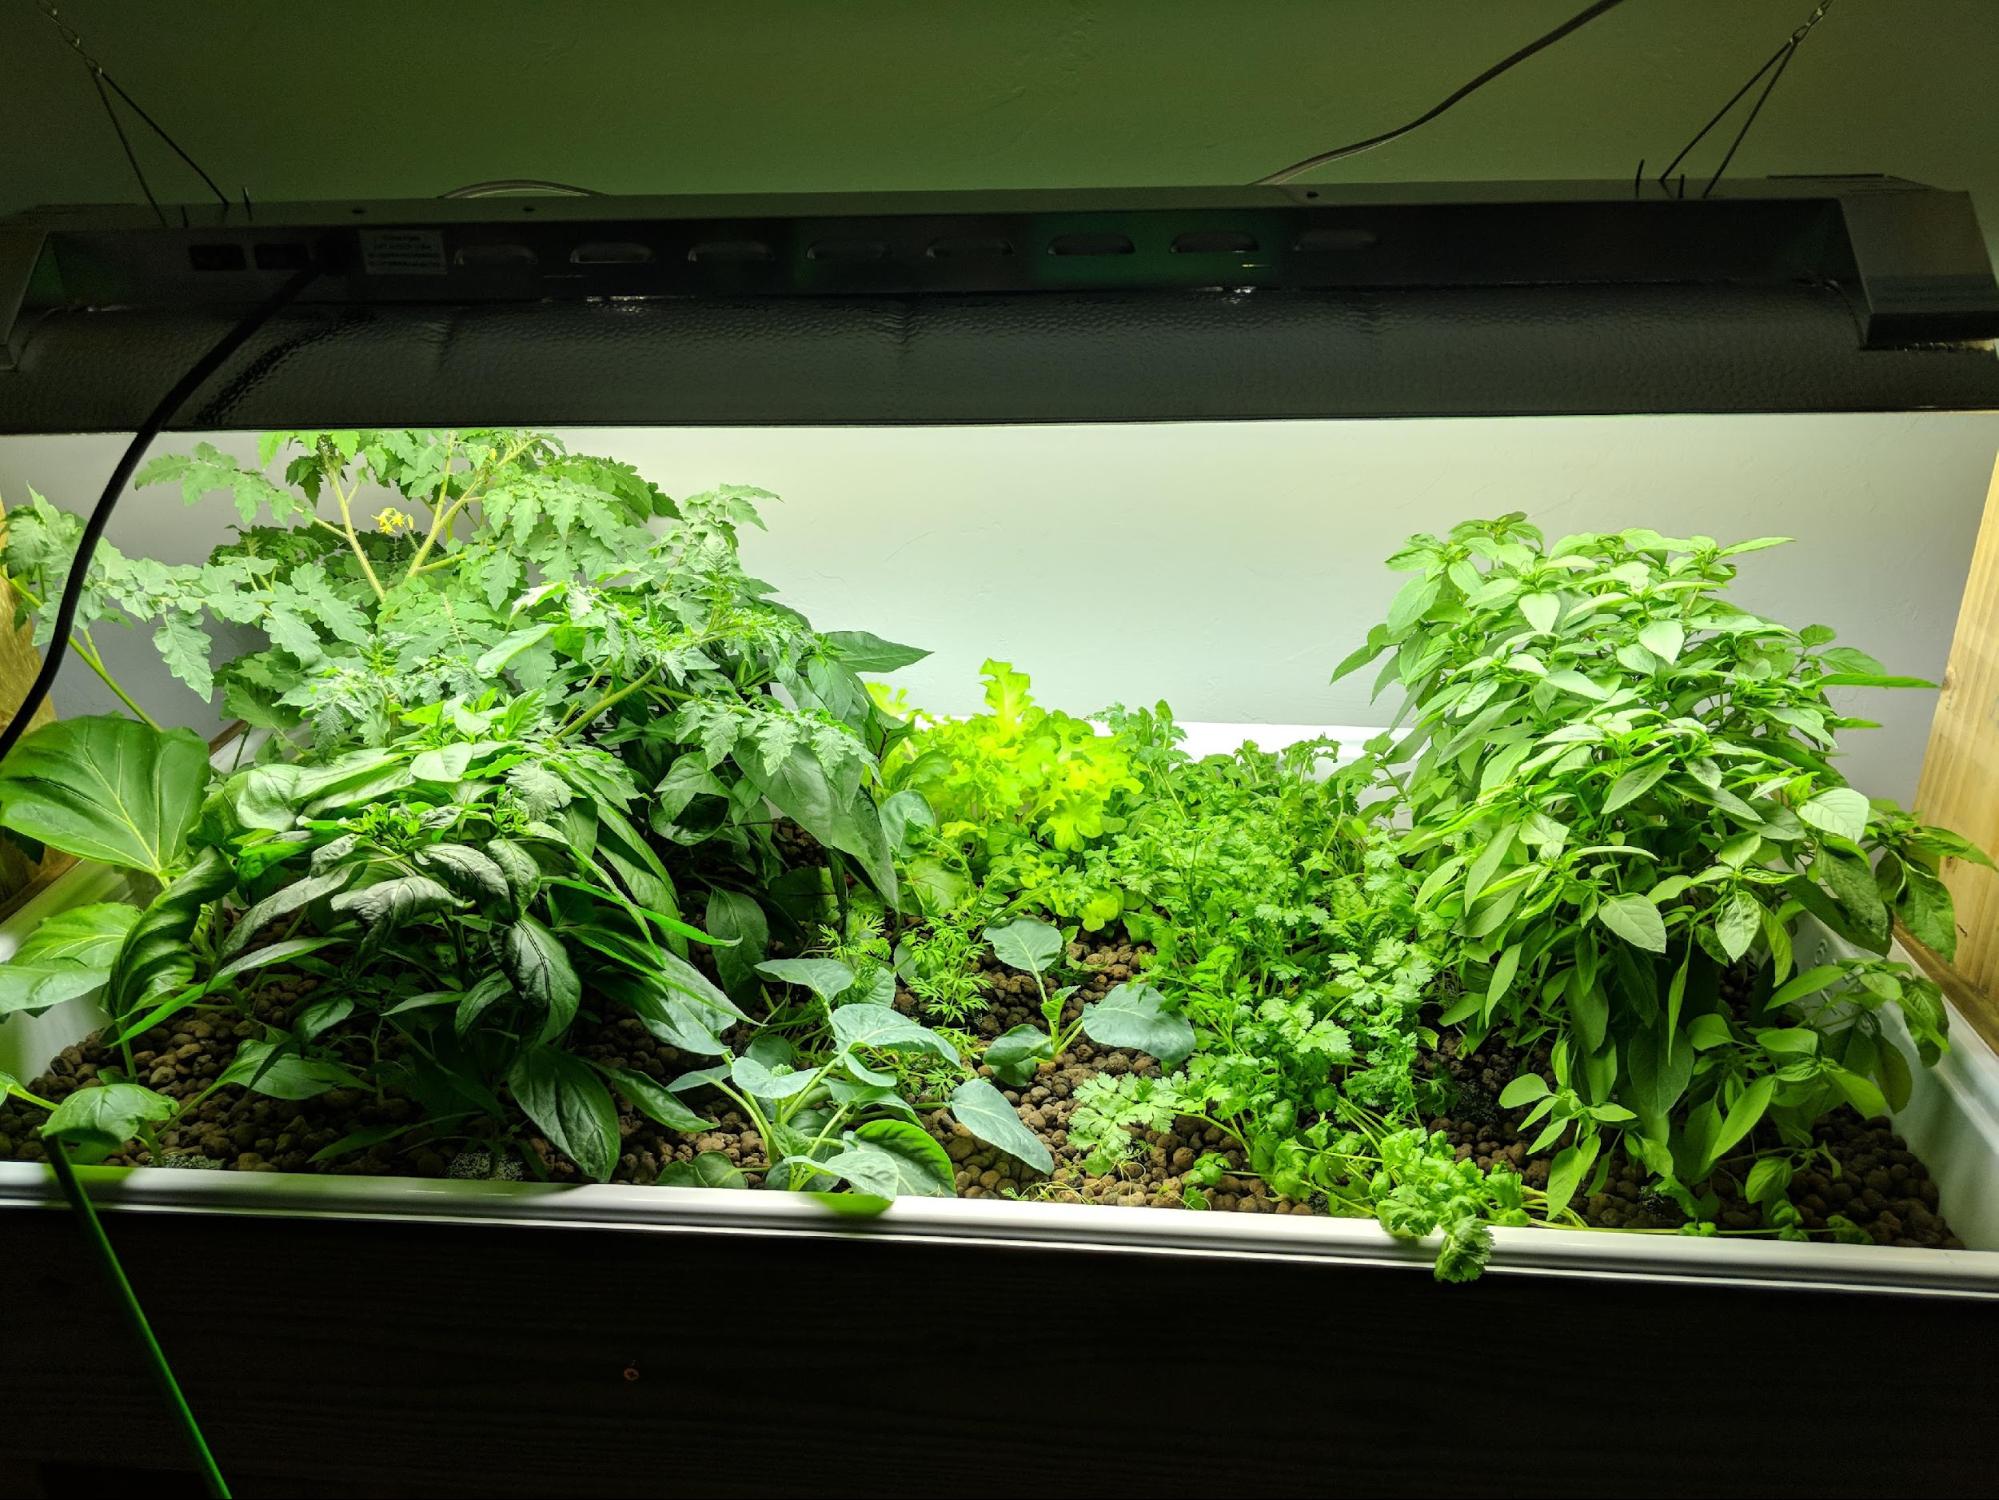
A healthy garden! Pro tip: Actually leave space for your plants to grow...
After a few trips to the hardware store, I had a sturdy ebb and flow garden full of little seedlings. Then I realized that the water can get too hot ... and the air in my garage gets too hot ... and evaporation can make the nutrient concentration toxically high ... and some seedlings rely on humidity for water until their roots mature.
Unlike my backyard gardening woes, my hydroponics troubles were easy to monitor, or even fix, with an Arduino and a handful of components!
Monitoring Garden Conditions
I dug out some sensors from the back of my closet and built a little system that monitors...
- Temperature of the tank water
- Temperature of the air in the plant tray
- Humidity of the air in the plant tray
- Electrical Conductivity (EC) of the tank water (indicates nutrient concentration)
I built the conductivity probe myself based on this guide. However, without any nichrome wire on hand, I just stripped the insulation off of some spare thermostat wire. I calibrated it to match the values from the EC/PPM tester that I already had, and it was ready to go.
I programmed the Arduino to read from each sensor every 6-ish minutes and send a JSON-encoded update to a little web server I had running in the cloud. The web server serves up the sensor data as JSON objects, so if I want to check the latest value or the whole history of values, the data is a quick curl away. I also set up a cron job to monitor the latest sensor values and email me if the any values are out of range or if the power goes out.
The additional monitoring helped out a lot. In hindsight, however, I was still missing out on a lot of information.
Monitoring My Garden with Gravwell
When I started using Gravwell, I realized that it would be a great tool for visualizing the information I'd been collecting from my garden. As much as I love reading JSON values, I was eager to see my data rendered charts that I could learn from at a glance.
Ingesting the Sensor Data
Ingesting sensor data from my garden was easier than I expected. Thanks to my little web server, I already had access to a giant JSON-encoded array sensor data...
$ curl <data endpoint>
[{"Air":30.3,"Water":29.5,"EC":14.16726,"Humidity":63.5,"Time":"2019-10-01T00:17:31.565187929Z"},{"Air":30.3,"Water":29.4375,"EC":13.99614,"Humidity":63.5,"Time":"2019-10-01T00:23:32.469888027Z"},{"Air":30.2,"Water":29.4375,"EC":14.10681,"Humidity":63.7,....]
... but before ingesting it, I wanted to break the array into adjacent objects. Luckily, json makes that trivial.
$ curl <data endpoint> | json -a
{
"Air": 31.25,
"Water": 27.0625,
"EC": 3872.974,
"Humidity": 0,
"Time": "2019-07-05T03:18:01.86626301Z"
}
{
"Air": 31.25,
"Water": 27.0625,
...
... and with one object per line ...
$ curl <data endpoint> | json -a -0
{"Air":31.25,"Water":27.0625,"EC":3872.974,"Humidity":0,"Time":"2019-07-05T03:18:01.86626301Z"}
{"Air":31.25,"Water":27.0625,"EC":4156.546,"Humidity":0,"Time":"2019-07-05T03:24:03.708650105Z"}
{"Air":31.1875,"Water":27.6875,"EC":3417.476,"Humidity":0,"Time":"2019-07-05T03:36:06.648683771Z"}
...
... easy! All that's left to do is ship the flattened data off to Gravwell. I installed the Simple Relay ingester (which is great for text based data), and...
curl <data endpoint> | json -a -0 | nc localhost 7777
That's it!
Rendering Charts
Once your data is in Gravwell, it's easy to render it into interactive charts. For example, viewing the air temperature (averaged over 1 hour windows) is as simple as...
tag=default json Air | stats mean(Air) as MeanAirTemp over 1h | chart MeanAirTemp
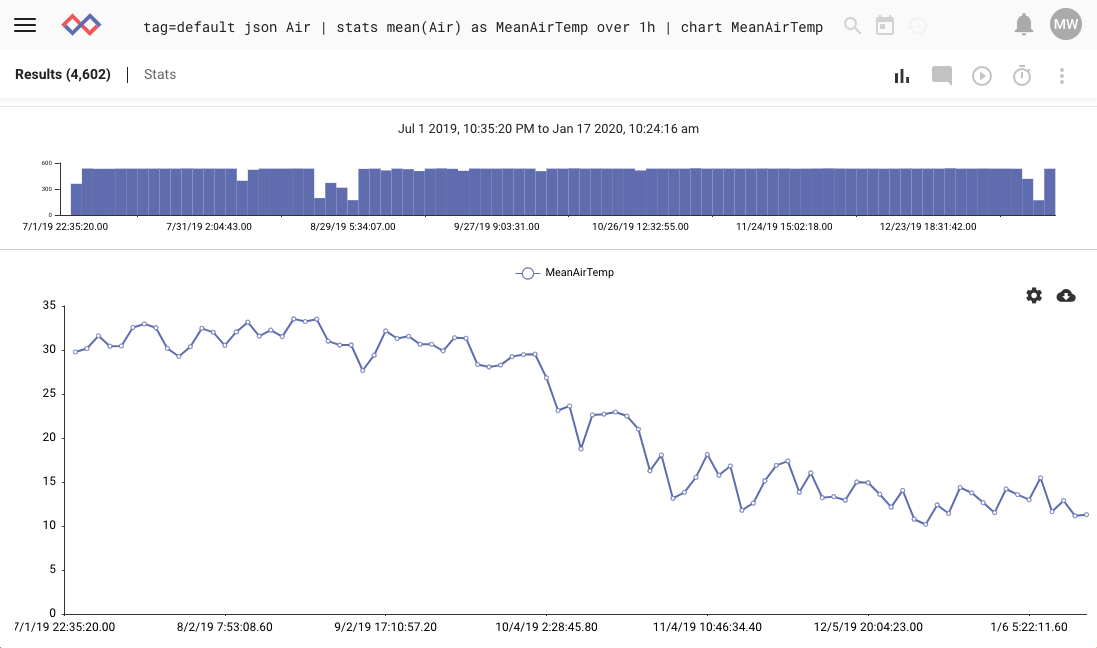
Air Temperatures averaged over 1-hour windows
With a few similar queries, we can put together a dashboard that shows the Air/Water temps, humidity, and electrical conductivity.
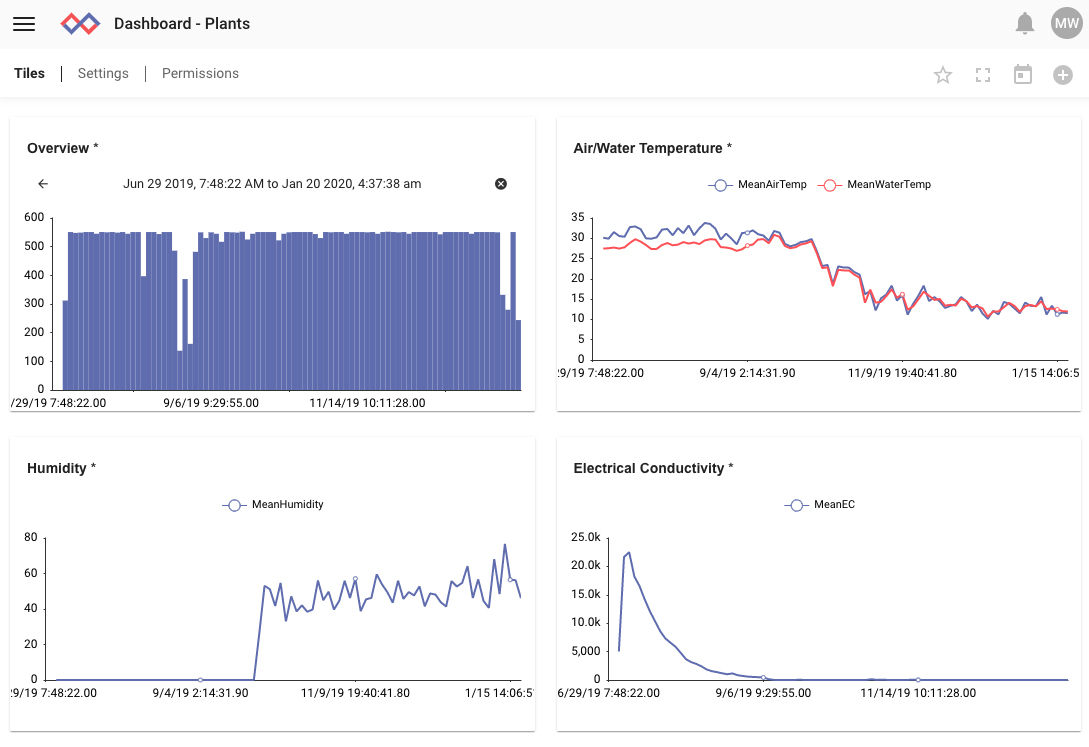
Plants Dashboard
Looks great!
Learning from sensor history
Glancing at the dashboard, I noticed a few things:
- The air temperature and water temperature remain similar, though the water temperature is slower to change.
- The humidity sensor was a late addition, so its value reads zero until the day I installed it. A closer look reveals that the humidity spikes when the garden is flooded and tapers off after.
- The electrical conductivity... ?
The EC is an indicator of the nutrient concentration in the garden's nutrient solution. For the plants I have growing in my garden, the EC should be around 1,000 to 2,500 μS/cm (1.0 to 2.5 mS/cm) to keep everyone happy. So, why would the concentration shoot up to ~23,000 μS/cm in four days and taper to nothing over time?
It turns out that copper thermostat wire was not a good substitute for nichrome wire in my homemade EC probe. If you run a DC current across copper terminals that are submerged in water full of various dissolved compounds, it corrodes. And evidently that corrosion affects the EC measurements.
I'd realized the EC values were wrong early on, but I didn't bother inspecting how the values were changing. It's interesting to see how the probe degraded over time, and Gravwell makes that easy.
Conclusion
Setting up Gravwell to monitor sensor data from my hydroponic garden was a snap. After installing the simple relay, I was issuing searches and rending charts within minutes. Now, I can get a solid understanding of my garden's health by glancing at a dashboard.
My next step is to configure my Arduino to send data directly to Gravwell and remove the web server as the middle man. That way, I can view my dashboard and manage alerts all in the same place. Eventually, I'd like to use Gravwell's scripting engine to control fans, lights, and other devices.
If you're interested in learning more about Gravwell, schedule a demo and one of our Gravwell guides can walk you through all of the benefits of our data fusion platform.