One useful feature of Gravwell is the ability to upload static data as "resources" for use in search queries. In this blog post, we'll walk through the process of uploading a CSV as a resource and using it in a search pipeline. These might be a csv of IP address blocks to human friendly name resolutions, for example, or maybe an auto-generated csv from a third party tool.
First, let's mention the use case that this blog post is NOT about: CSV as changing time-series data. If you frequently update a CSV and the timeline of its changes is important, then automating the collection of this data is key. By treating it like any other log entry and ingesting it as time data, you can easily track changes and time-correlate with other data sources. Many tools also offer the option to "export to splunk", which can be easily pointed at Gravwell for time data analysis.
The rest of this blog post assumes we will not be doing this. Instead, we will uploading as a static resource and perform non-temporal data analytics.
Once you have the file, go to the "Tools and Resources" tab in Gravwell's side menu and click the "Resources" button.
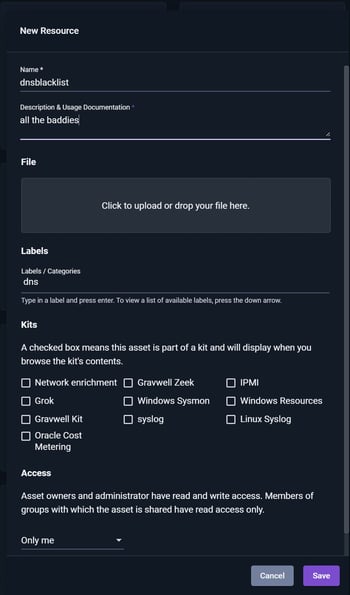
Select the CSV file from your computer and give it a name. In this example, the CSV contains a dnsblacklist of domain, category, provider so the name for this resource will be "dnsblacklist".
In Gravwell, use the side menu -> Tools and Resources - > Resources. Find and click on the "+Add" on the top right corner of the GUI.

A "New Resource" window will appear to upload files and provide details.
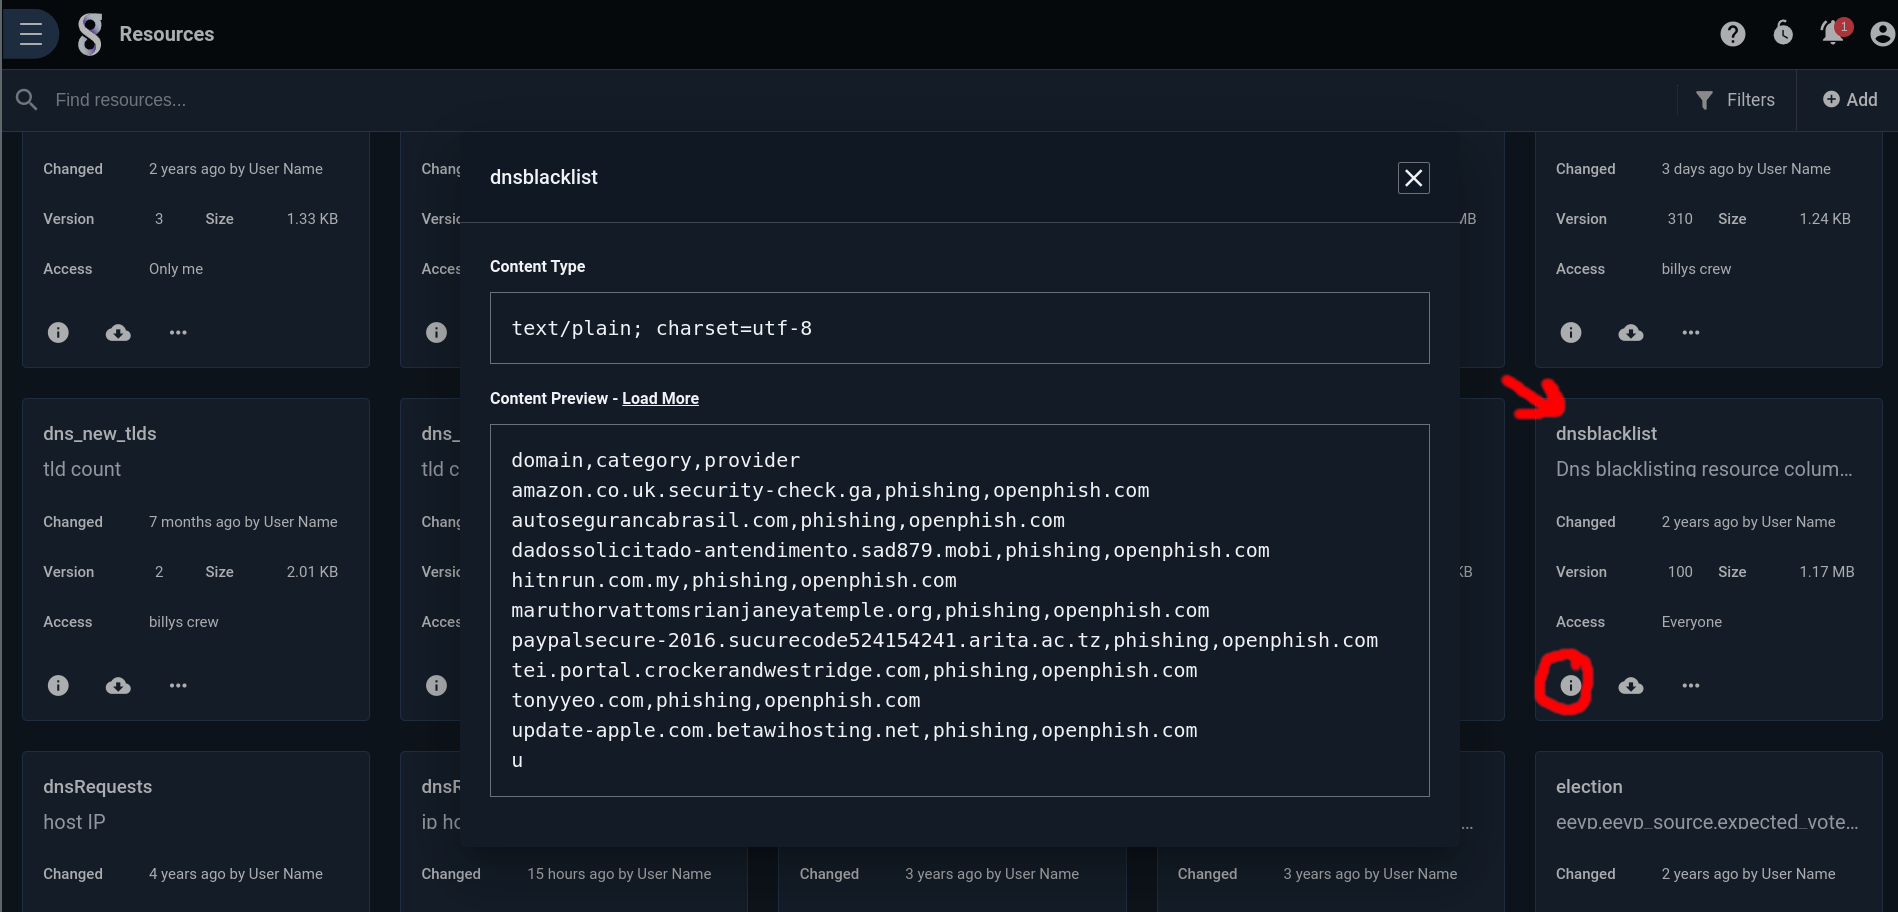
Once uploaded, you can verify the contents of your new resource by clicking on the Information icon. Now that its loaded into Gravwell, you can use it in a search pipeline just like you would any other data.
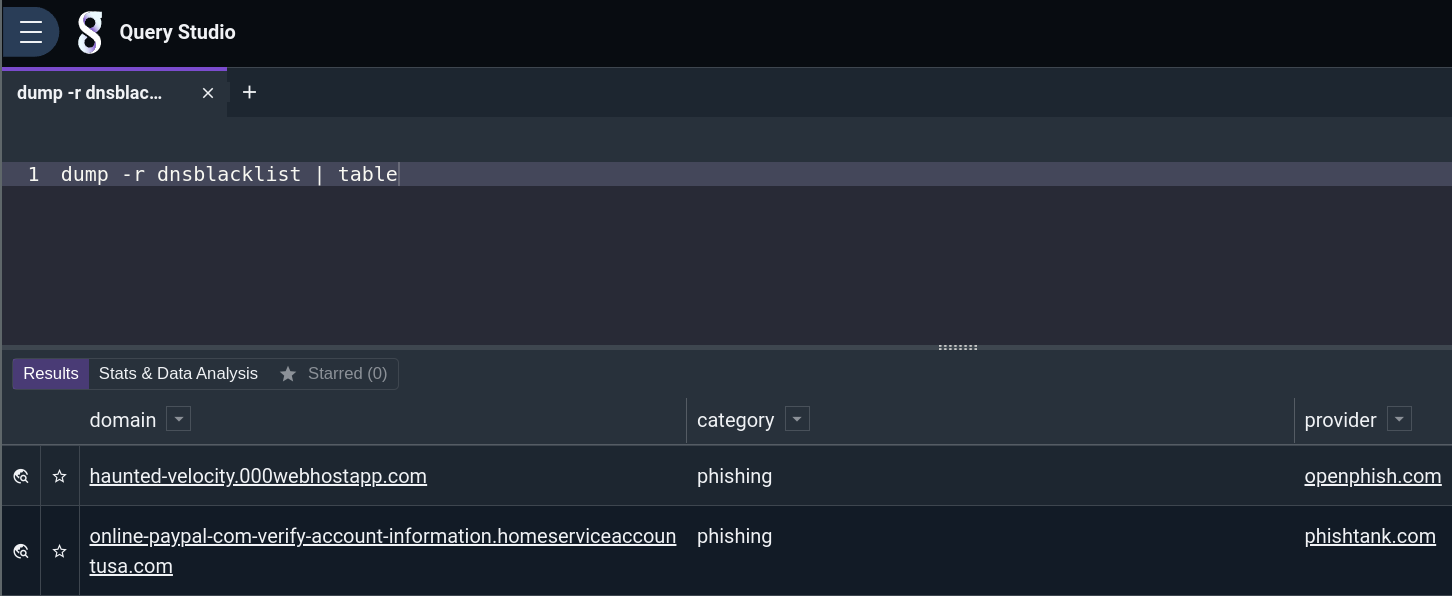
Using the side menu, navigate to Query Studio and run a search. To do this, we'll use the "dump" module with a table extractor
dump -r dnsblacklist | table The dump module allows you to "dump" the contents of a resource into the search pipeline as if it were log entries. This is useful because it allows you to manipulate the data in the same way you would any other data in Gravwell.
Add in some aggregate processing to calculate how many categories the file has, visualize domains by provider, and other such analytics. The following query counts by category, sorts by count, and displays as a table.
dump -r dnsblacklist | stats count by category | sort by count desc | table category count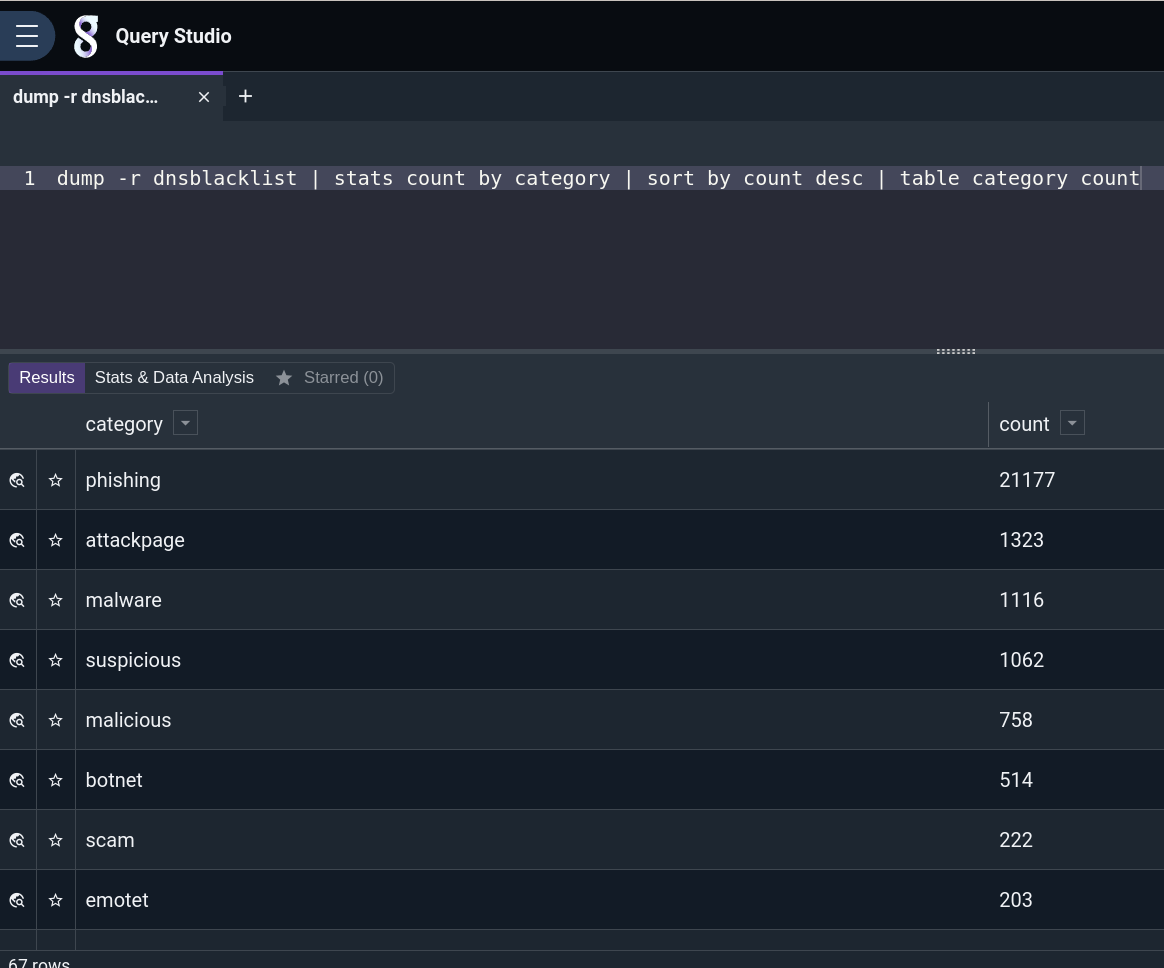
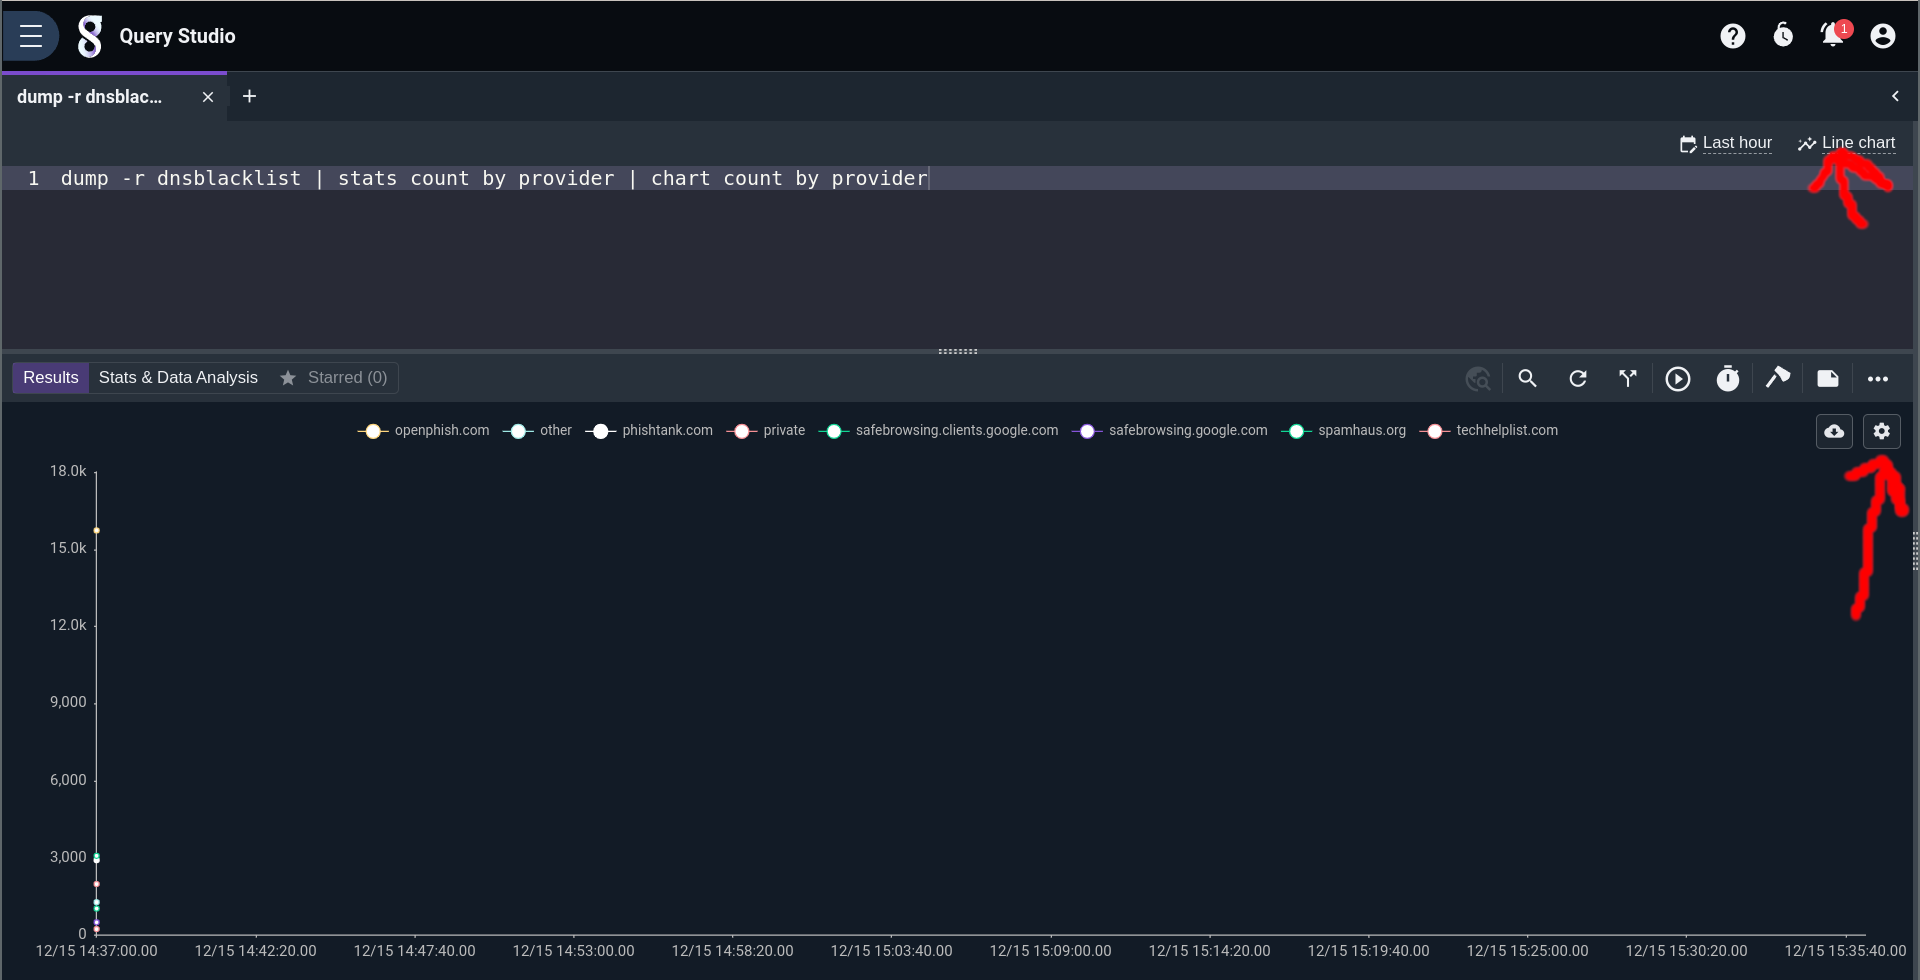
Alternatively, we can group by provider and produce a chart of the results with this query:
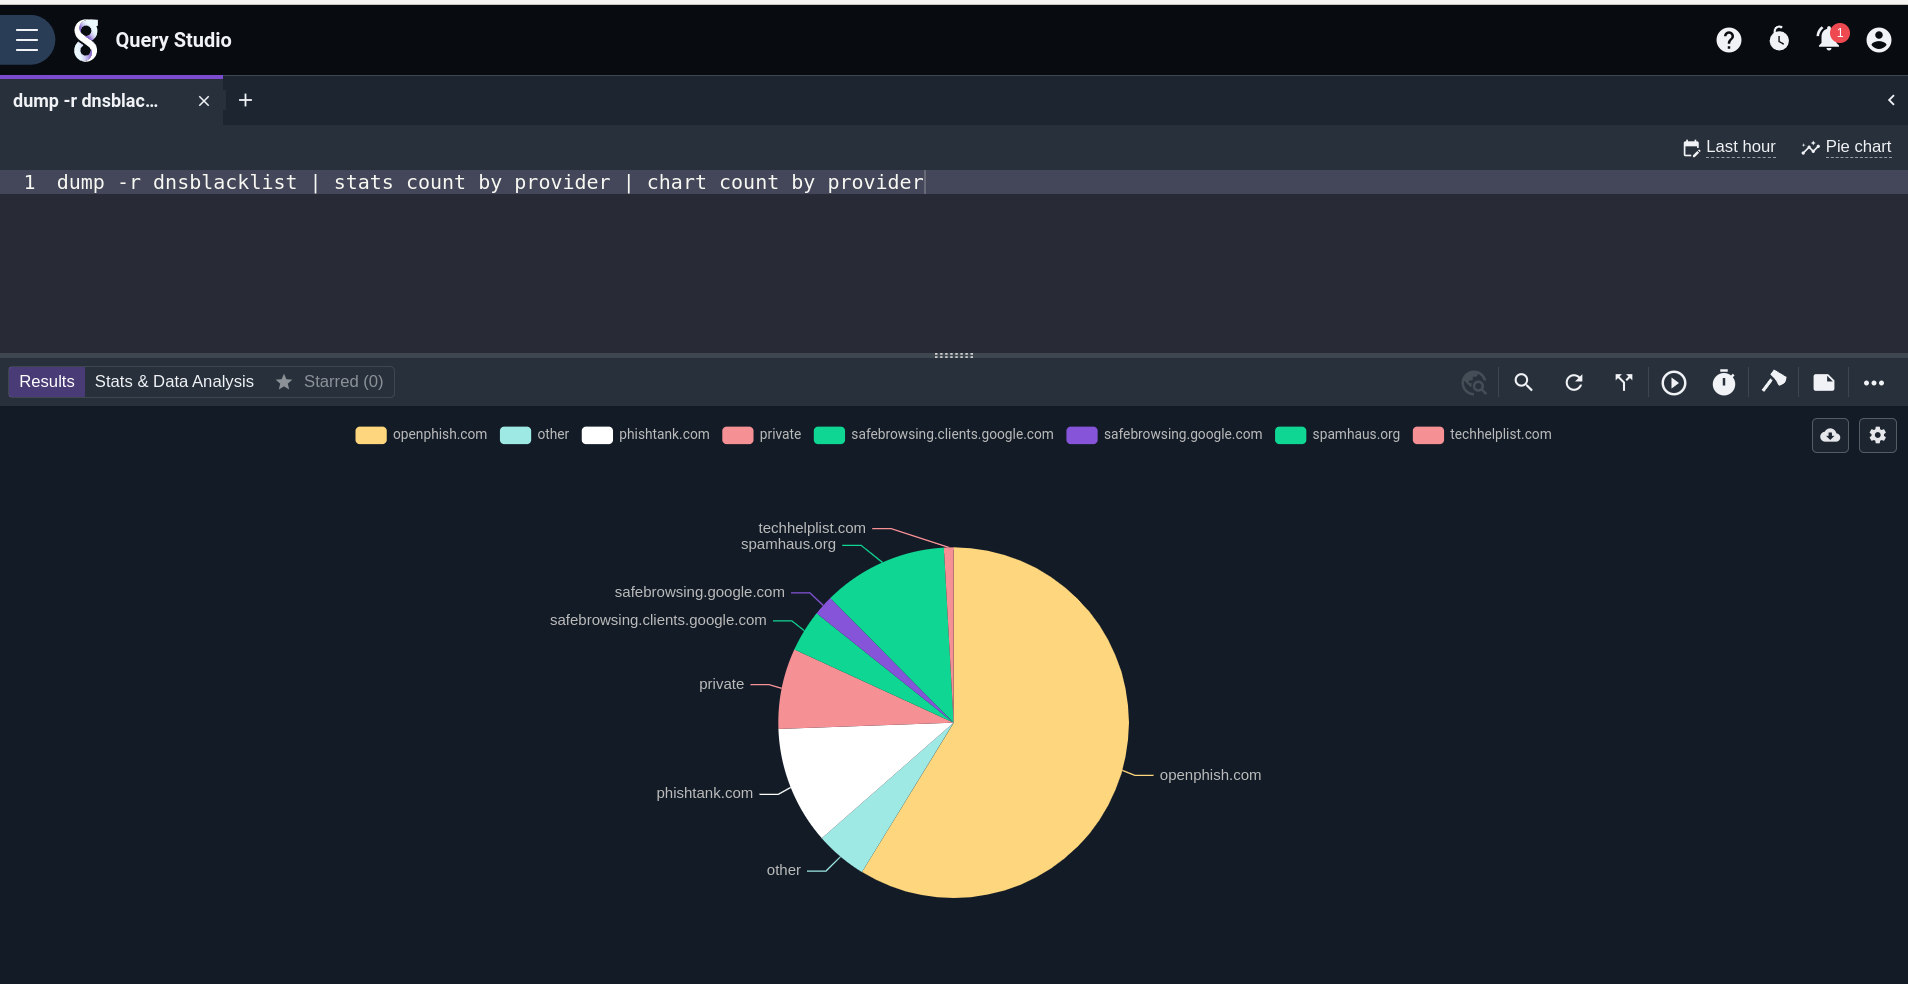
dump -r dnsblacklist | stats count by provider | chart count by provider Prefer a Pie chart? Click on the gear icon to quickly change the visualization.
Want more tips and tricks? Join our Discord community and get help from directly from our Dev team, like putting IP addresses from a CSV on a map!