Time is one of the most powerful elements to log and event data. Sadly, it is also one of the most underutilized for a few reasons. First, it's heavily dependent upon retention - the more time range you have covered, the better you can train models on your actual data and environments. Secondly, the time-based analysis also relies on time-based indexing, and many log analysis tools are not indexed time-first.
At Gravwell, we built a time-series data lake from scratch because we wanted to solve these problems and do so at scale. Before founding the company, I worked on the offensive side of cybersecurity at several places. As a result, I can confidently say that an attacker who is willing to take their time and do as much "living off the land" as possible will not be detected by virtually every IDS/IPS. However, they do leave a trail of weak signals for analysis.
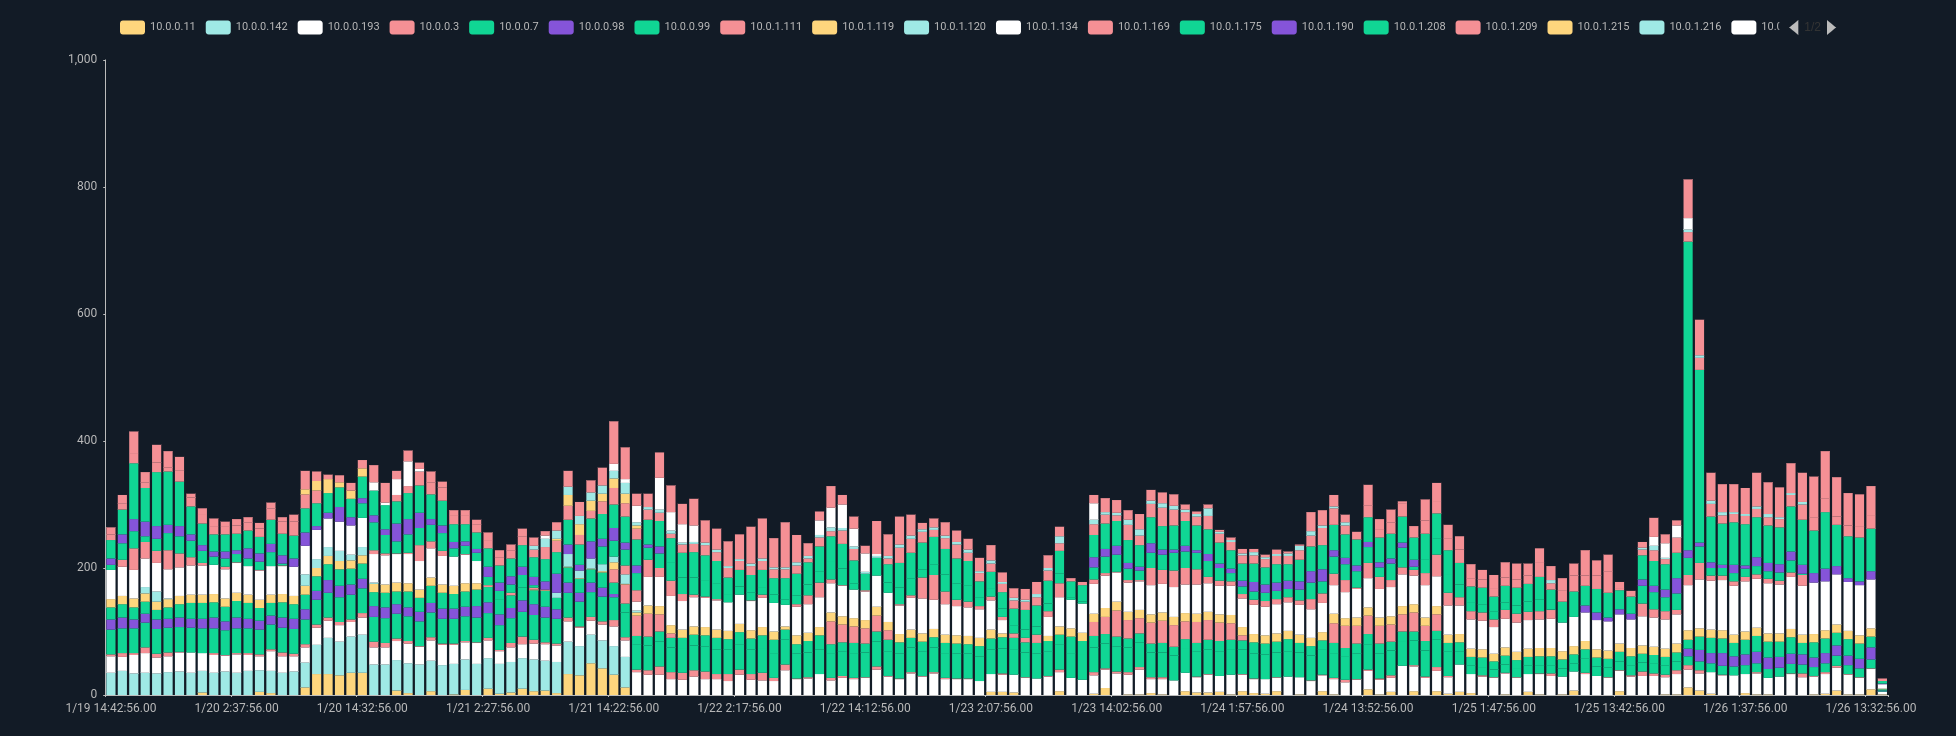
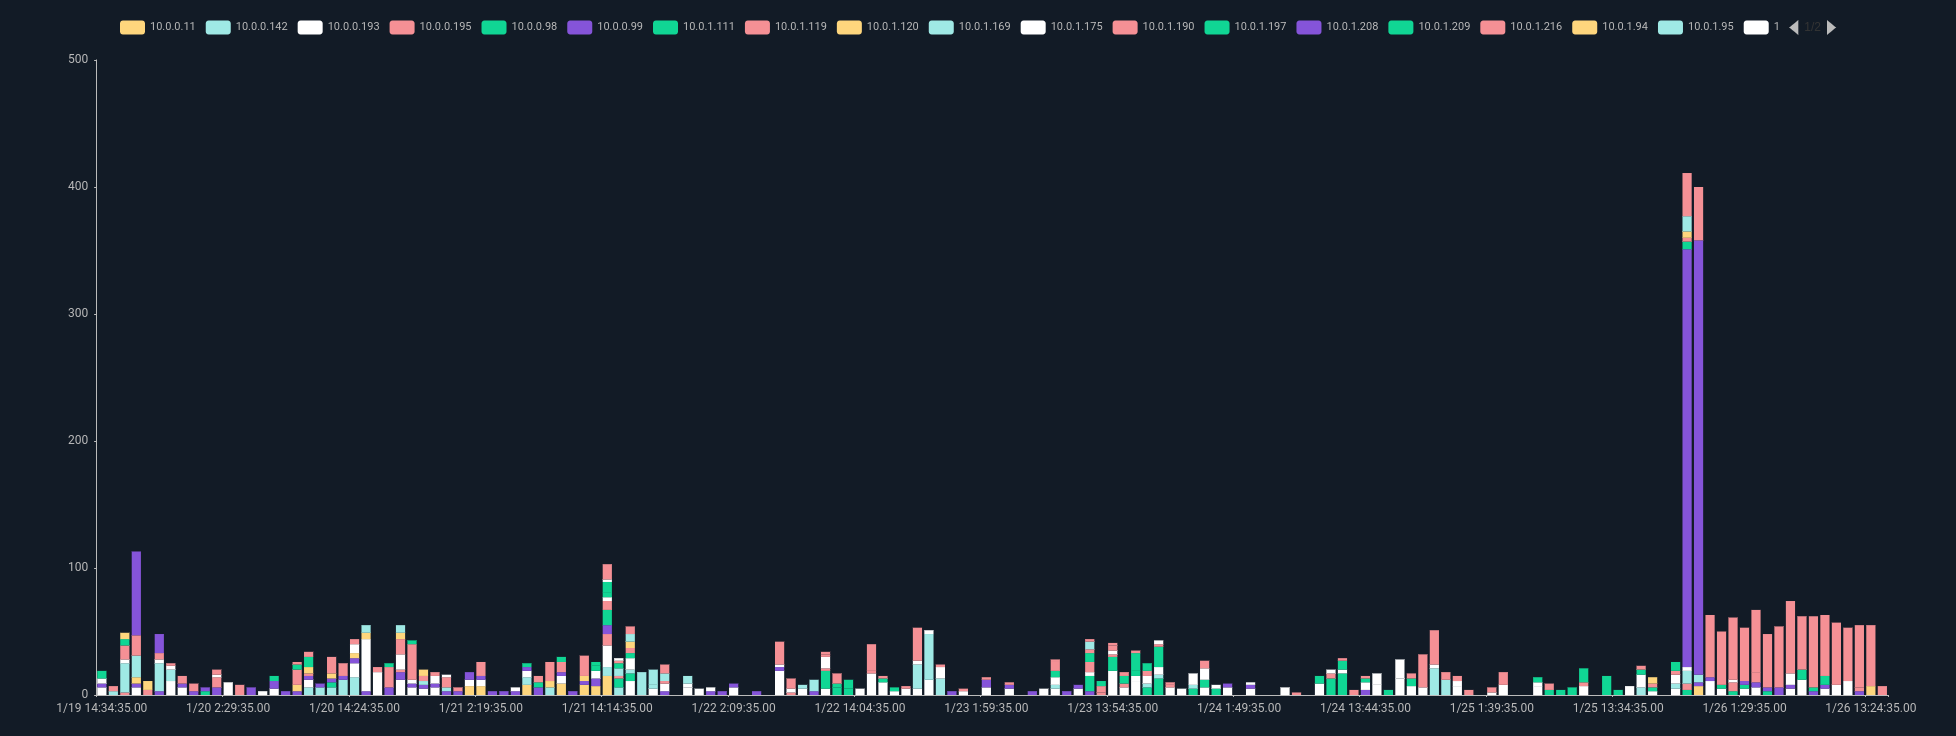
Here's an example of extracting weak signals from a single data source. This advanced query takes Zeek connection log data as an input. It first passes over the data to build a statistical model of private-to-private network connections, on a per-host basis, bucketed into 5-minute windows. Then, a second pass over the data applies this model to filter out anything less than two standard deviations away from the normal that was defined in the building of the model. The final results are weak signals that indicate hosts creating a statistically significant number of network connections.
@stats{tag=zeekconn ax orig resp resp_port | ip orig~PRIVATE resp~PRIVATE | stats unique_count(resp_port) by orig resp over 5m | stats sum(unique_count) by orig over 5m
| stats mean(sum) by orig stddev(sum) by orig
| eval stddev != 0
| table -nt orig stddev mean};

tag=zeekconn ax orig resp resp_port | ip orig~PRIVATE resp~PRIVATE | stats unique_count(resp_port) by orig resp over 5m | stats sum(unique_count) by orig over 5m
| lookup -r @stats orig orig (stddev mean)
/*change the "*2" to be more extreme with how many stddevs it takes to stand out*/
| eval sum > toFloat(mean)+(toFloat(stddev)*2)
| chart sum by orig limit 20
Go from this:
To this:
The best part about building an analytics pipeline for arbitrary data is that you can be insanely flexible with it once created. If I wanted to narrow the scope of this technique down to only port 445 traffic, I just have to tweak the query to add a filter as a separate module or inline with the extractors: `tag=zeekconn ax orig resp resp_port` becomes `tag=zeekconn ax orig resp resp_port=="445"`
By itself, this query isn't game-changing. It has some use individually, but the real power comes when we correlate this weak signal with others. By creating similar queries for other data sources, we can identify hosts behaving slightly differently than they usually do. In addition, these weak signals can be temporally correlated to create a story of how the system behavior has changed.
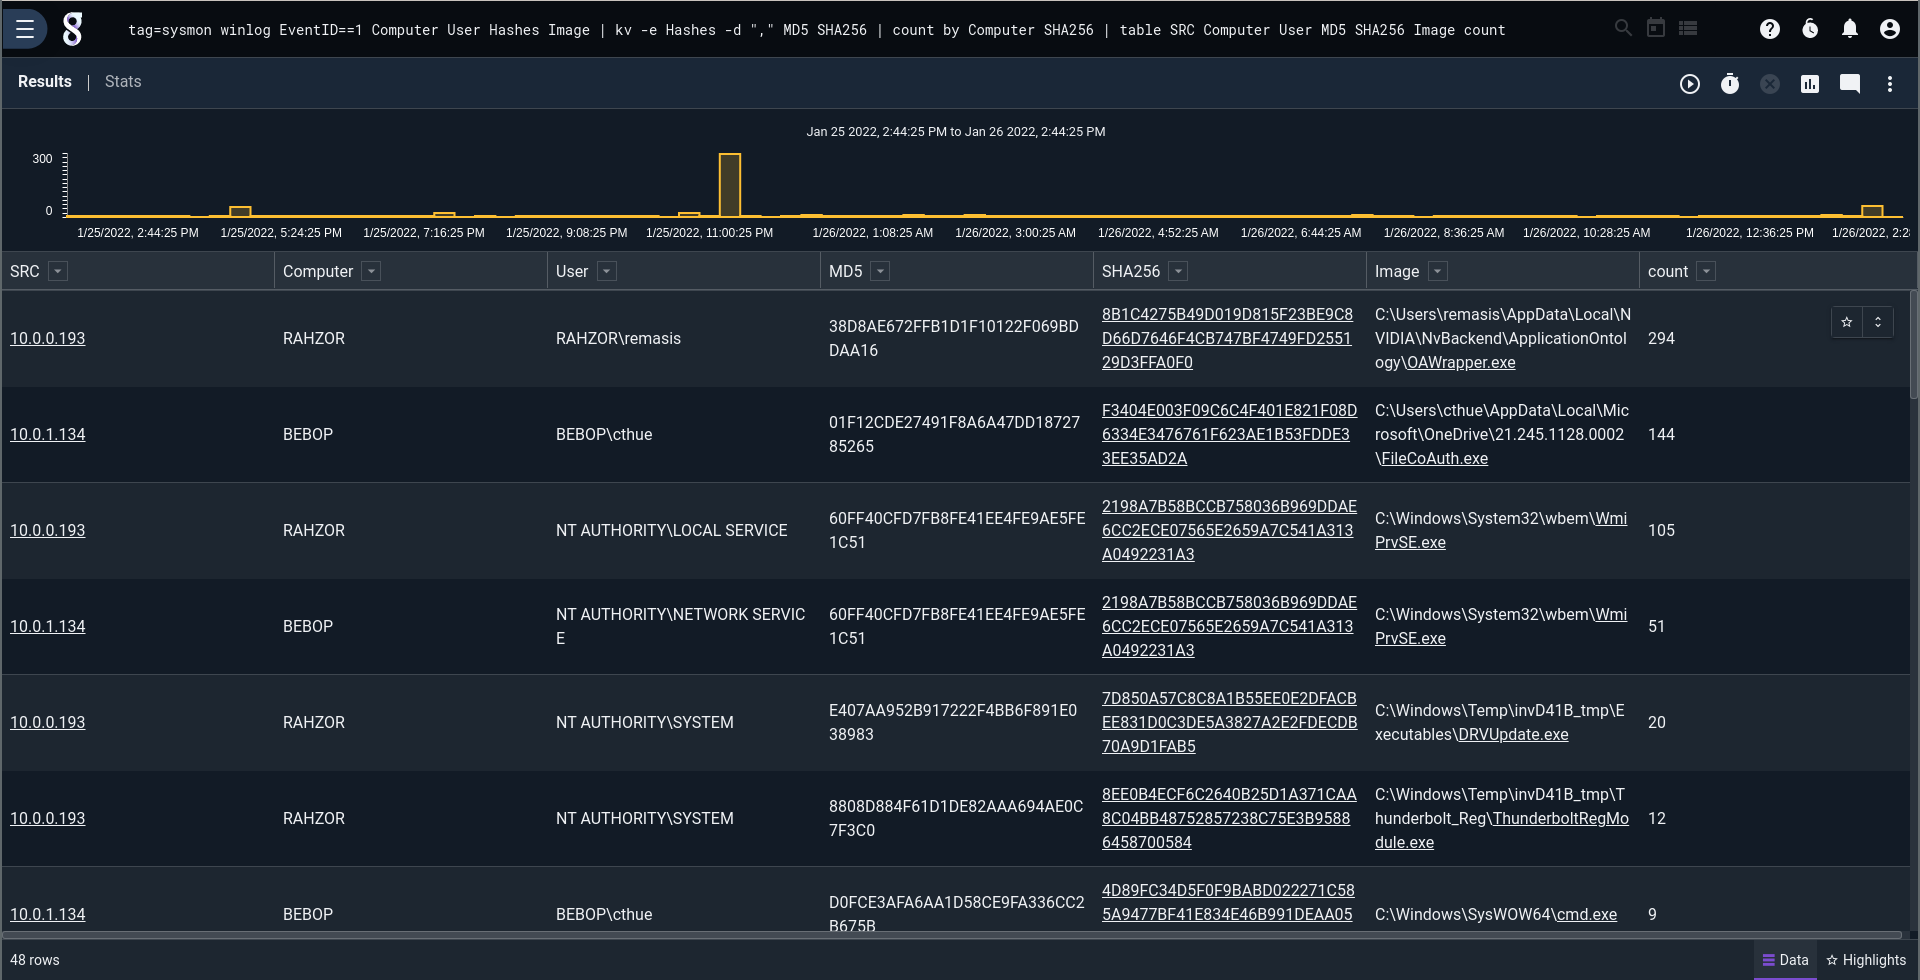
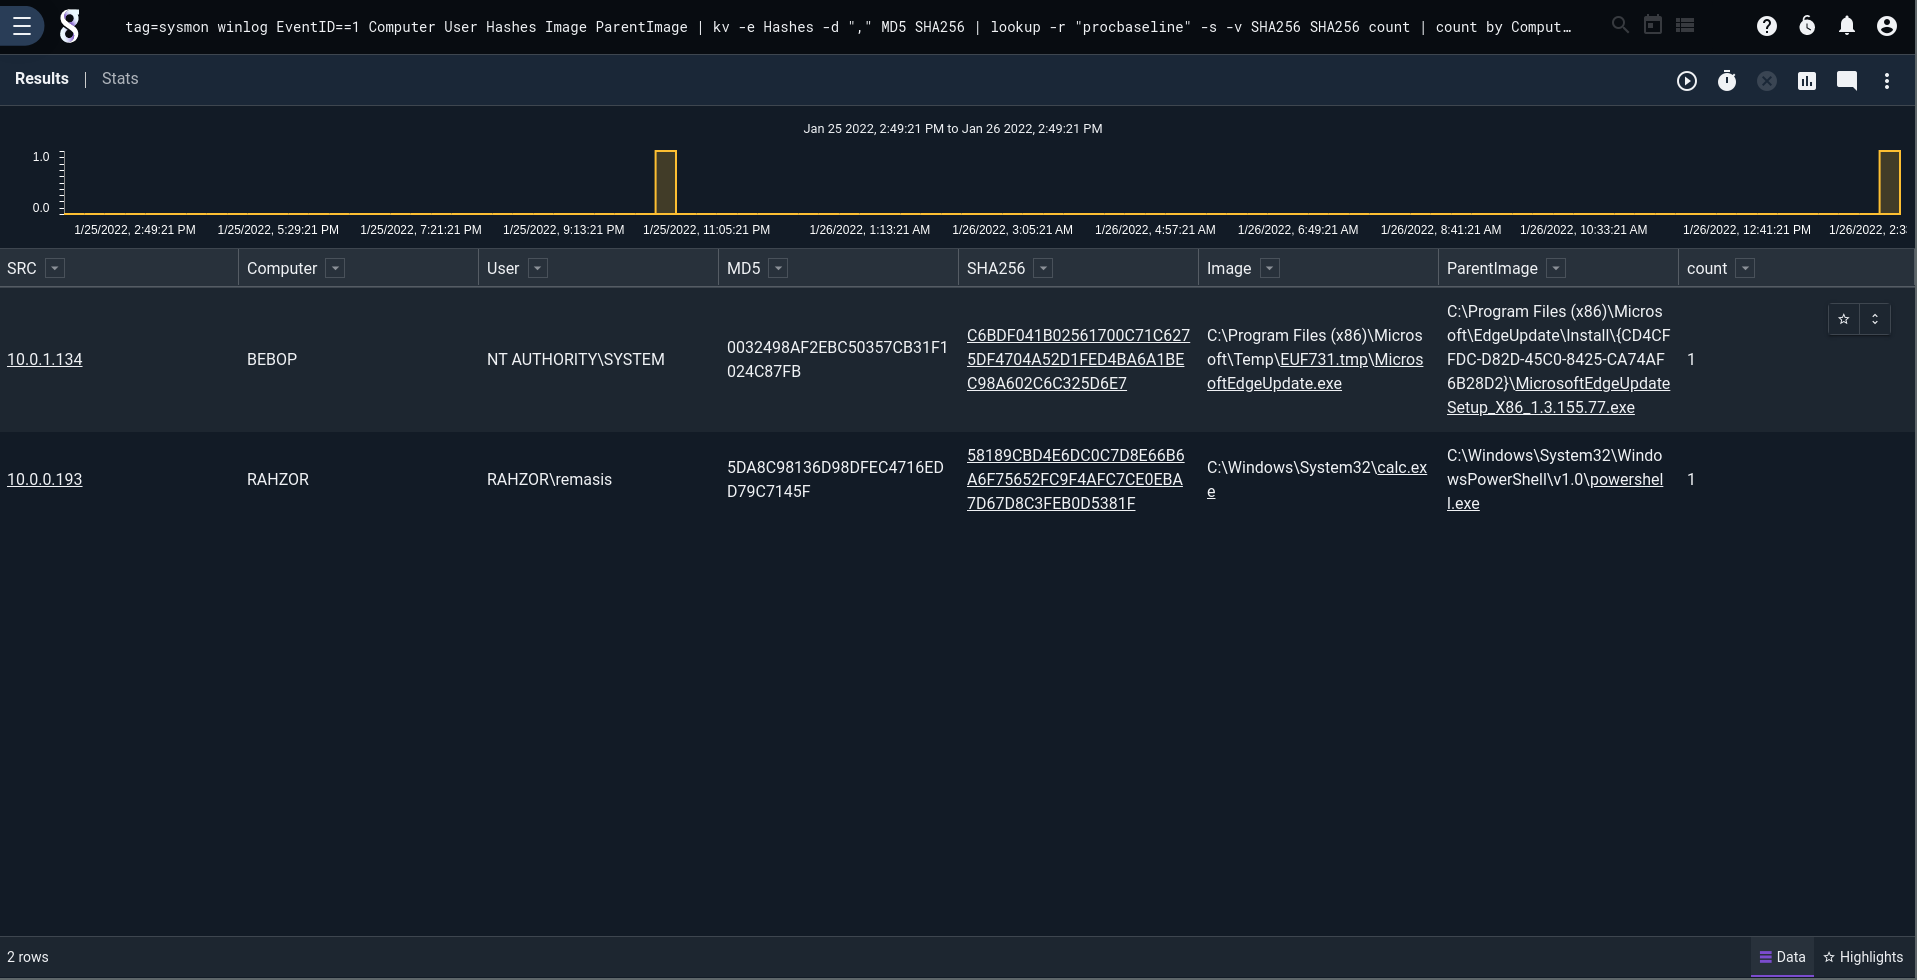
Here's a query that runs over a period of time to build a process allowlist using Sysmon data. Sysmon is a fantastic data source for any windows endpoint because it gives you complete exe & dll logs, DNS logs, and a lot more. The Gravwell `table` module allows for saving the results as a resource (in this case called "procbaseline") which we can reference in another query to identify any changes. Again, a bit too noisy to make this a "strong" signal and create an alert any time there's an allowlist violation, even on a domain controller, but a fantastic signal to correlate with other activity.
Create the baseline with a date range of five days prior to the relevant period of investigation:
tag=sysmon winlog EventID==1 Computer User Hashes Image
| kv -e Hashes -d "," MD5 SHA256
| count by Computer SHA256
| table -save procbaseline SRC Computer User MD5 SHA256 Image count
And referencing the baseline to find allowlist violations:
tag=sysmon winlog EventID==1 Computer User Hashes Image
| kv -e Hashes -d "," MD5 SHA256
| lookup -r "procbaseline" -s -v SHA256 SHA256 count
| count by Computer SHA256
| table SRC Computer User MD5 SHA256 Image count
This first screenshot is a search showing all processes that were executed on any windows endpoint that's being monitored. The list is far too large for a human to peruse. The second screenshot is a list of only process allowlist violations.
Go from this:
To this:
These types of queries help you gain defenders' advantage by understanding what's present on the network, how hosts behave, and what's normal for your organization. They are helpful for cybersecurity and DevOps. Things really get taken to the next level when all of this is automated, and the first few steps of threat hunting are done for you. It's far better to start from a report including all anomalous network traffic, process allowlist changes, process denylist violations, and other machine-gatherable information.
Automated weak signal correlation brings that feeling of omniscience that we want in our IT environments. No question should be unanswerable. Nothing so much as sneezes on the network or hosts without you knowing about it. When all your data is in one place in its raw, actionable form and not normalized into impotence, you really do feel like an all-seeing, all-knowing master of your data universe.