We are happy to announce the release of version 0.2.6. This release has your standard array of bug fixes and quality of life improvements but the major change comes in the form of relational analytics enhancements. We have added support for force directed graphs which allow for some advanced relationship analytics and data correlation.
We have an instance of Gravwell running that ingests data from the Reddit comment API. This data playground is a super fun (and sometimes frightening) place to experiment, especially when exploring relationships between commenters.
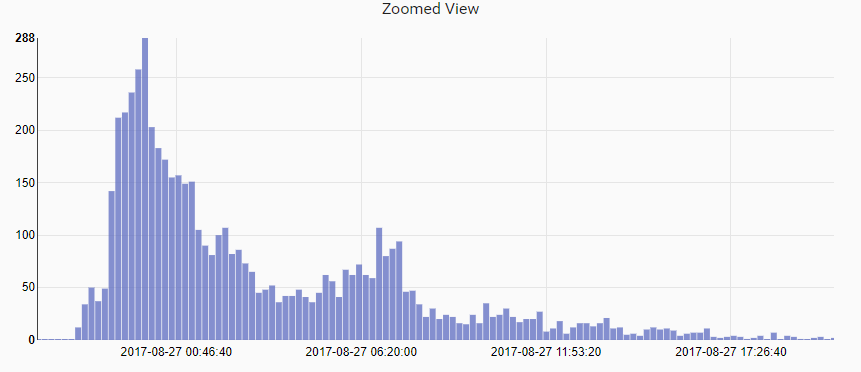
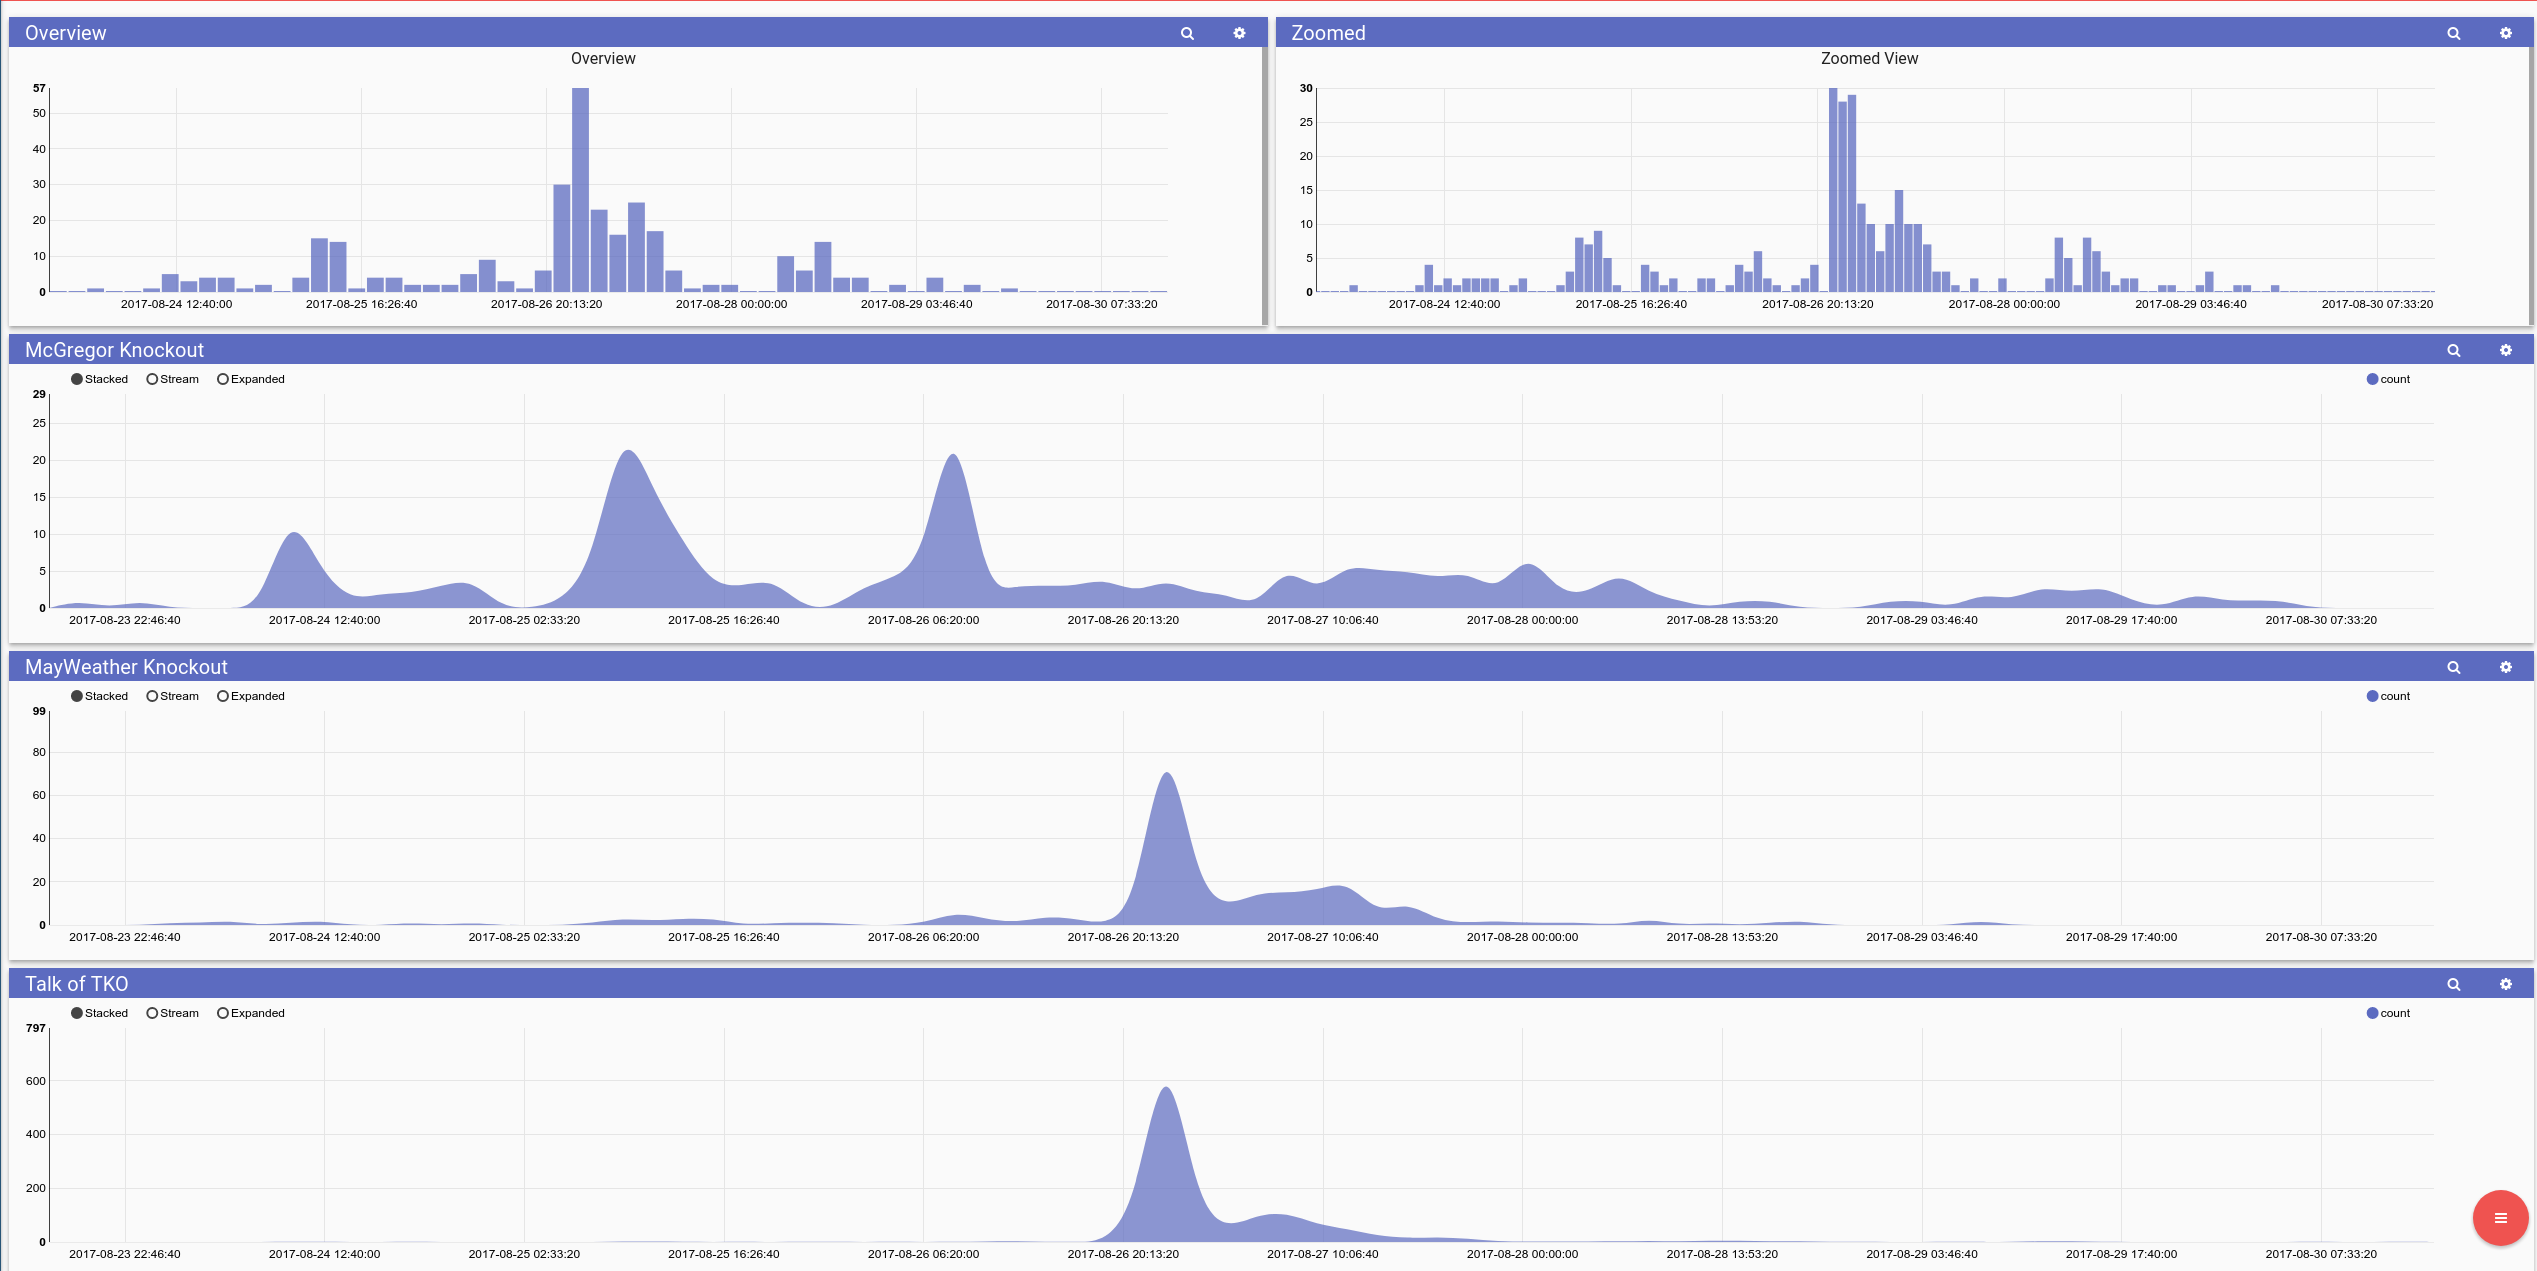
A popular topic over the weekend was the much hyped Mayweather vs McGregor fight. We ran a search for people talking about this popular video:
Mayweather vs. McGregor finish
The frequency of posts started slow, picked up rapidly, and then trailed off over the following day -- which, following the arc of any briefly popular topic, is to be expected.
We then ran a force directed graph search of all users who were commenting to each other about the fight. Soon after the video was posted a couple of users stand out as top-level commenters or drivers of discussion.
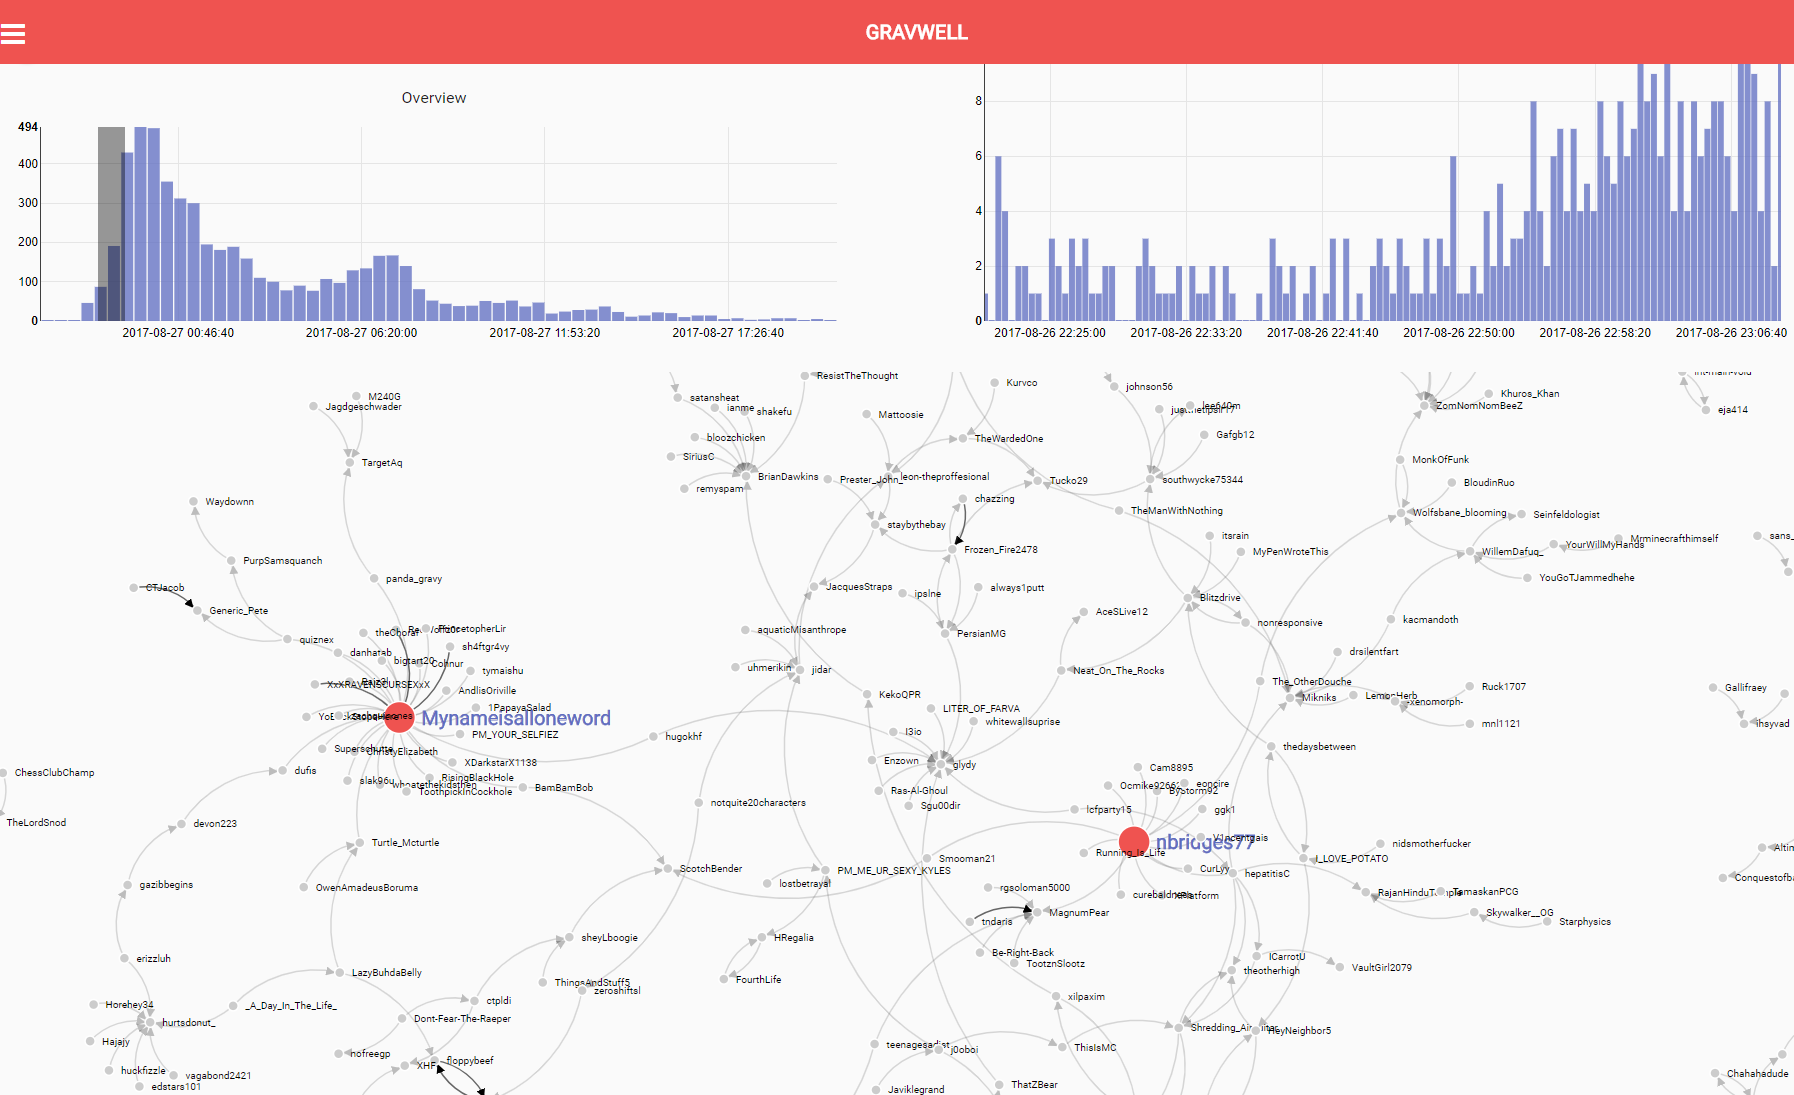
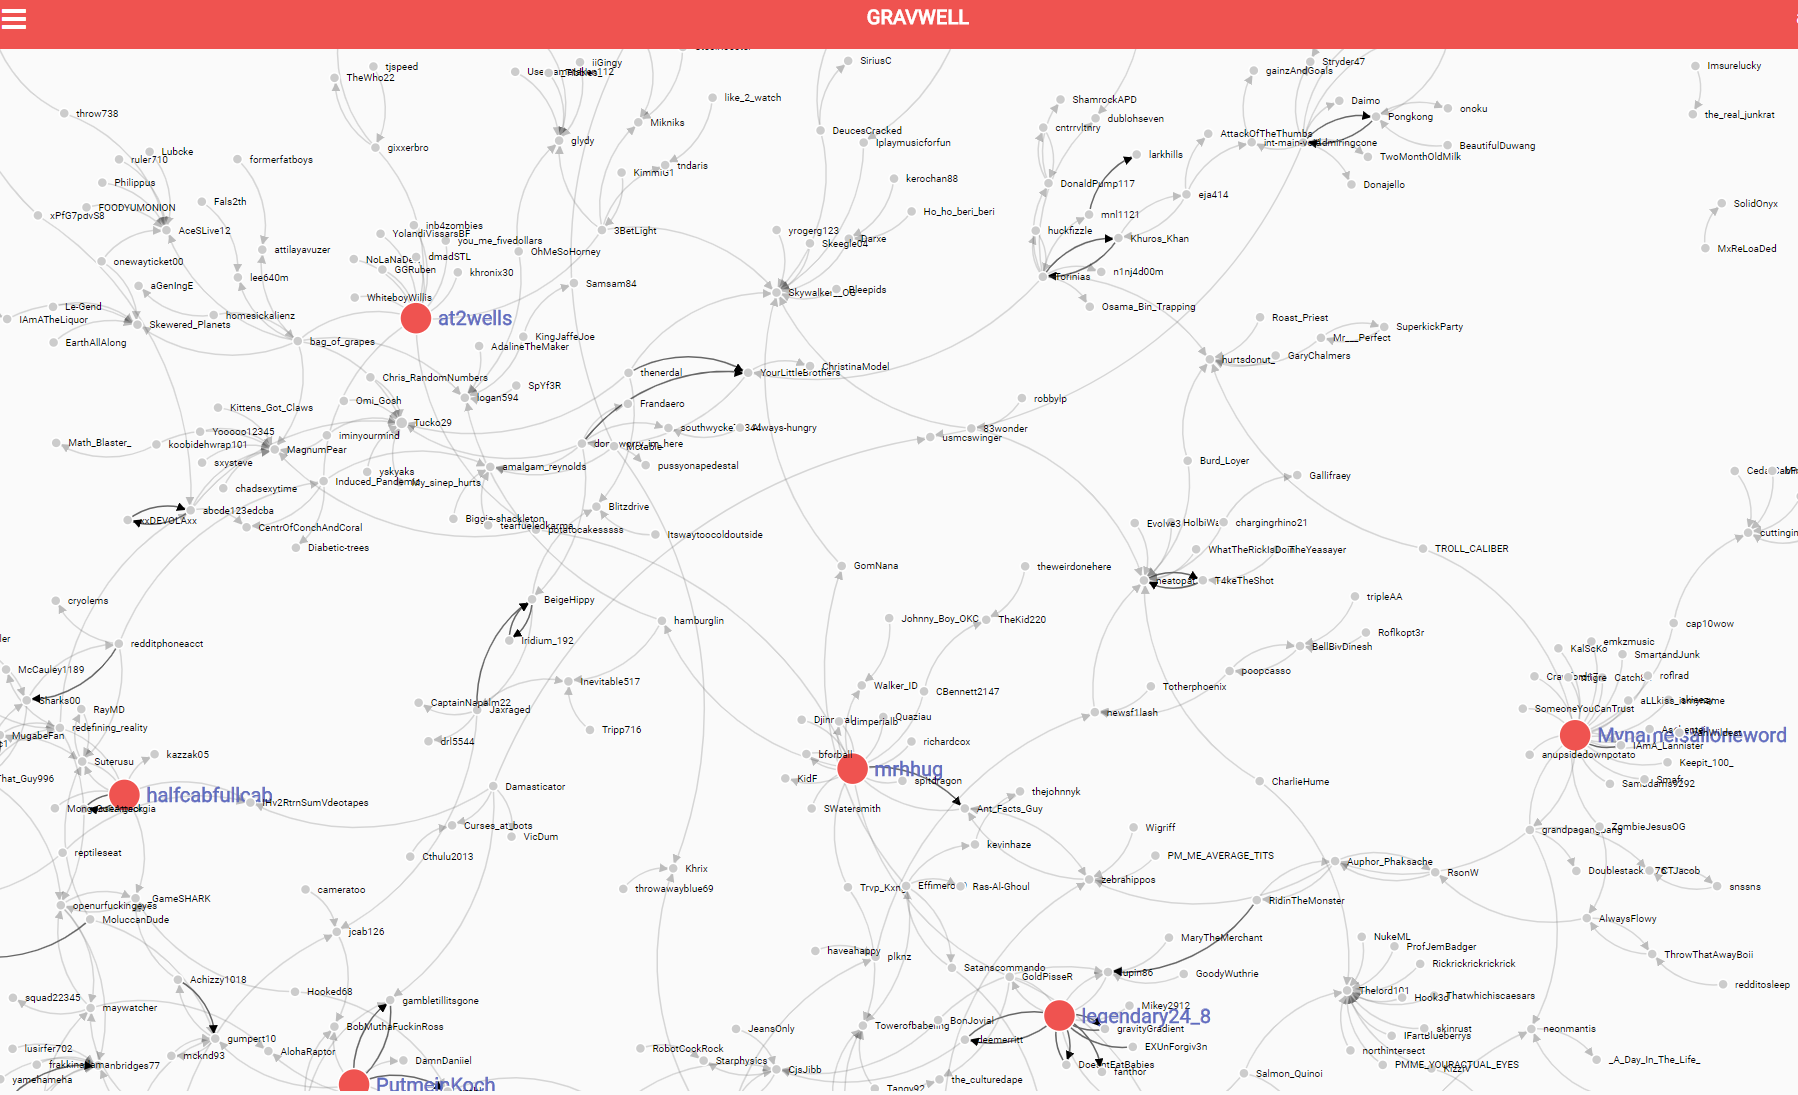
During the period of most discussion, much more activity is visible. The structure holds as conversation clusters around a few users and chains begin to develop of users commenting to each other.
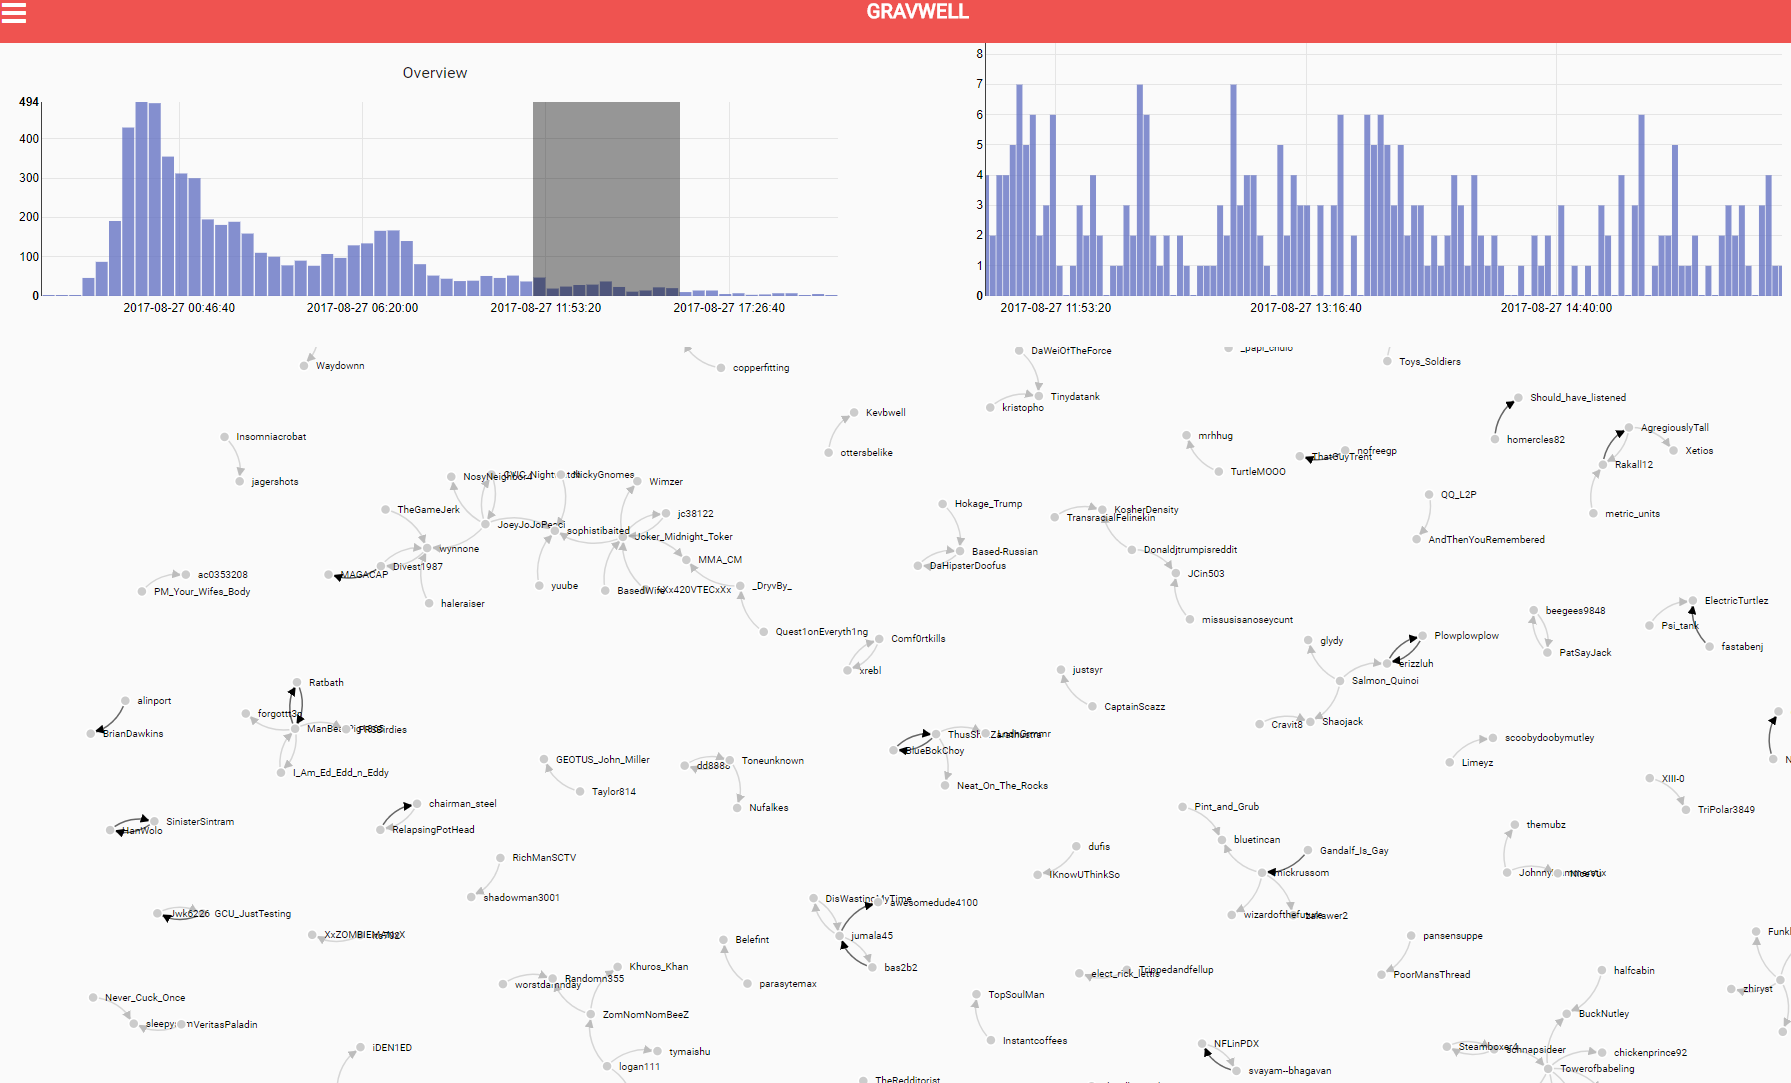
As conversation begins to cool off, users are seen participating in individual discussion chains and there is much more separation between commenters. One conversation chain stands out as sparking continual discussion about the topic but most users aren't interacting with many other commenters. As always, Gravwell provides an easy way to get to the underlying data -- these graphs are generated at search time based on executed queries, so the same data that we collected before the force directed graph module was complete can still be analyzed using FDG (or any new feature to come).
Force directed graphs are an incredibly powerful tool for presenting information in a way that allows humans to do one of the only things we do better than computers -- pattern recognition. One practical technical application of this feature (and the reason we developed it) is for tracking air-gap jumping malware that propagates via USB thumb drives. By starting the hunt with a force directed graph of all USB drives and the systems with which they interact, the scale and nature of the infection can be quickly understood. Getting a high-level overview of what the team is facing is immensely valuable when planning a response.
We're experimenting with ways to combine this presentation with our video analytics for graphing proximity relationships between individuals which can be useful for security or health purposes. The team is doing some really great work and I'm looking forward to what we've got in the pipeline (subscribe so you don't miss our upcoming "epidemiology" module post).
We also did some basic frequency charting for discussions around a knockout for each fighter and TKO to see where reddit was leaning during the fight. Early on there's a few swells for a McGregor knockout up until near Mayweathers actual TKO when discussion rapidly switched to Mayweathers corner for analysis.
If data agnostic search analytics are something that get you excited, subscribe to our blog for more posts like this. Hit that Free Trial button if you're interested in getting a hold of Gravwell yourself.