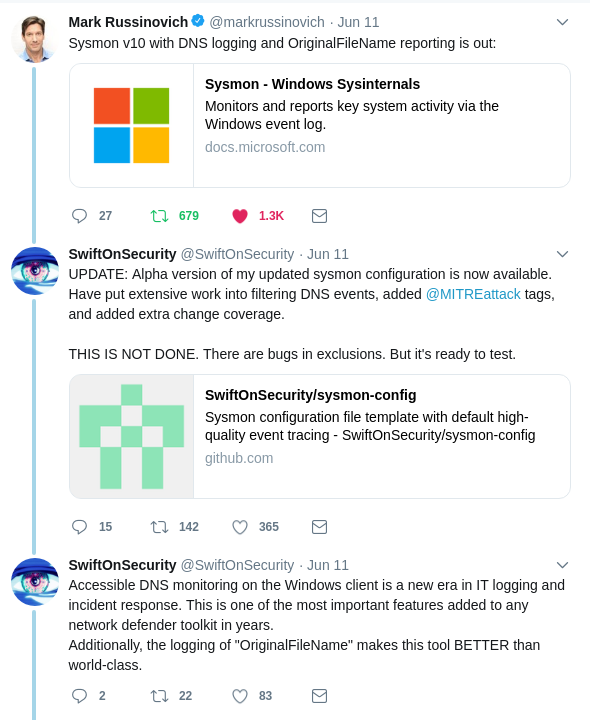
This month has been a big deal for IT logging of windows endpoints. Sysmon v10 was released last Tuesday and it includes the major changes of DNS logging and OriginalFileName reporting for Windows events. If you've ever tried to set up Windows DNS logging before, you understand how awesome this is. This post is all about the new functionality and how to make use of it in Gravwell.

I stole this meme from @ExtremePaperC
Paul's Security Weekly
If you prefer your blogs in video format, you can kind of follow along with episode 608 of Paul's Security Weekly.
What is Sysmon?
"System Monitor (Sysmon) is a Windows system service and device driver that, once installed on a system, remains resident across system reboots to monitor and log system activity to the Windows event log. It provides detailed information about process creations, network connections, and changes to file creation time." - sysinternals
Why is Sysmon useful?
Sysmon is great because it produces operations events and EDR from your windows endpoints, all for free (as in beer)! It's really easy to install and super lightweight so you can be comfortable running it on systems that require high availability (I'm looking at you ICS). Sysmon produces concise events for stuff you care about like process creation, file creations, registry modifications, and now DNS. Contrast this with standard events in the Windows event viewer which have a ton of noise, filtering isn't easy, and useful stuff is missing.
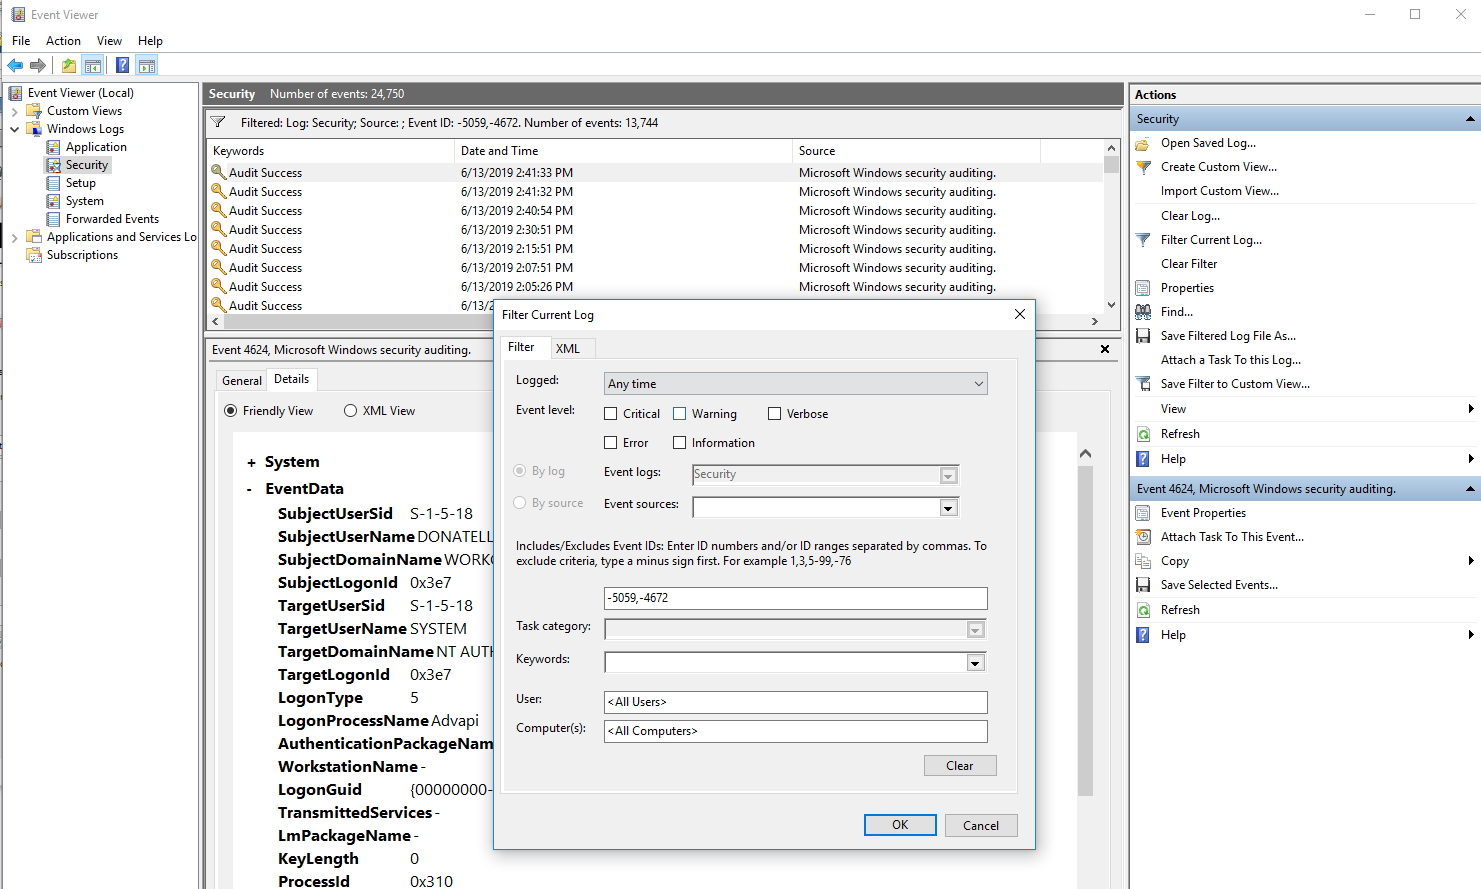
Trying to filter out noise in the Windows event viewer makes me a sad panda
Let's take a look at an example event generated by executing calc.exe from within powershell.

The Process Creation event is generated (EventID 1)
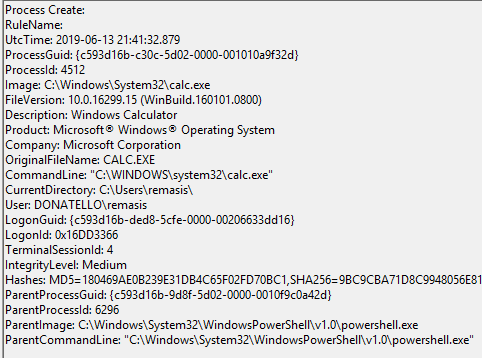
Details of the event can be used for threat hunting and correlation
Sysmon DNS is exported as XML (in this case by the Gravwell windows events ingester)
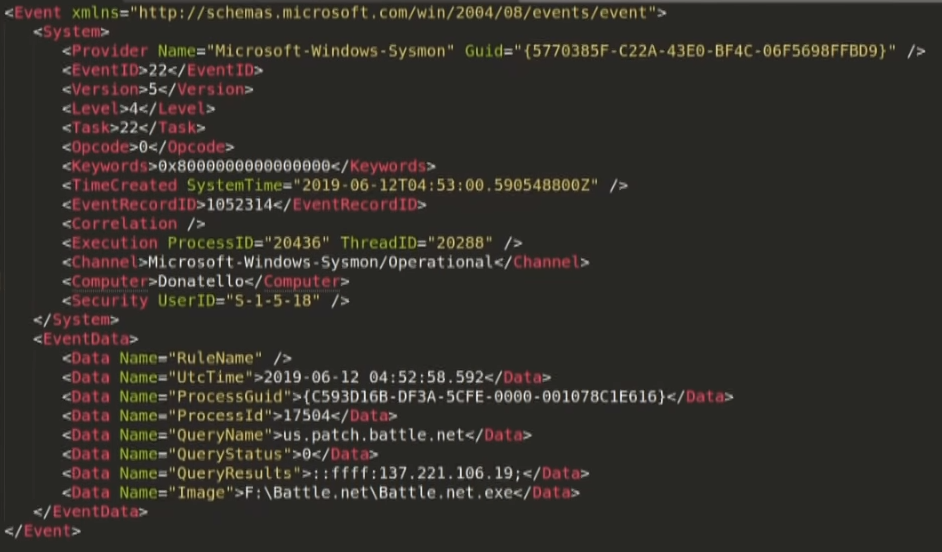
The core properties that anyone doing DNS threat hunting using sysmon EDR would look at are Computer, QueryName, QueryResults, and Image. These indicate DNS requests made by a given binary executable, where they were two, what was returned, and which computer made the request.
Symon Configuration
As we can see, Sysmon can generate a lot of really useful information. If you have many endpoints it will generate A LOT of really useful information. One of the nice features of sysmon is the support of a configuration file that can do some filtering. You need this if you are stuck using an archaic pay-per-byte analytics solution, but even Gravwell customers with unlimited ingest might still utilize this to cut down on disk usage.
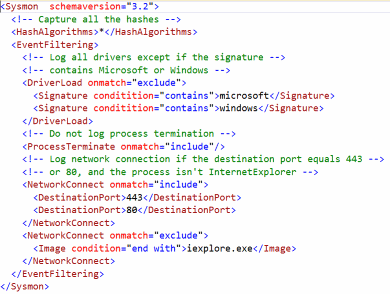
Configuration files are XML files that make it easier to deploy a preset configuration and filter captured events.
Hot on the heels of the Sysmon v10 release comes an update from our favorite pop star infosec diva, @swiftonsecurity. For those who may not be aware, Tay has created a popular configuration file for Sysmon that adds some filtering and enrichments. It serves as a fantastic baseline for sysmon deployment. They also had the opportunity to spend some time with the update before its release, so the configuration file updates aren't just an off-the-cuff adjustment.
The Sysmon configuration file is available at sysmon config and contains plenty of comments and annotations about what each line does so it's really easy to tweak as needed. Because Gravwell is pretty powerful and we have unlimited data ingest, I removed the non-Microsoft DNS filtering from Tay's config so that I was getting almost all DNS events forwarded on to Gravwell.
DNS Analytics
Using the Gravwell Windows Events Ingester, I forwarded all Sysmon events up to my Gravwell cluster for easy analysis. We'll start by doing a super basic search of extracting the Windows event properties using our "winlog" module and then piping them to a table renderer module for ease of observation.
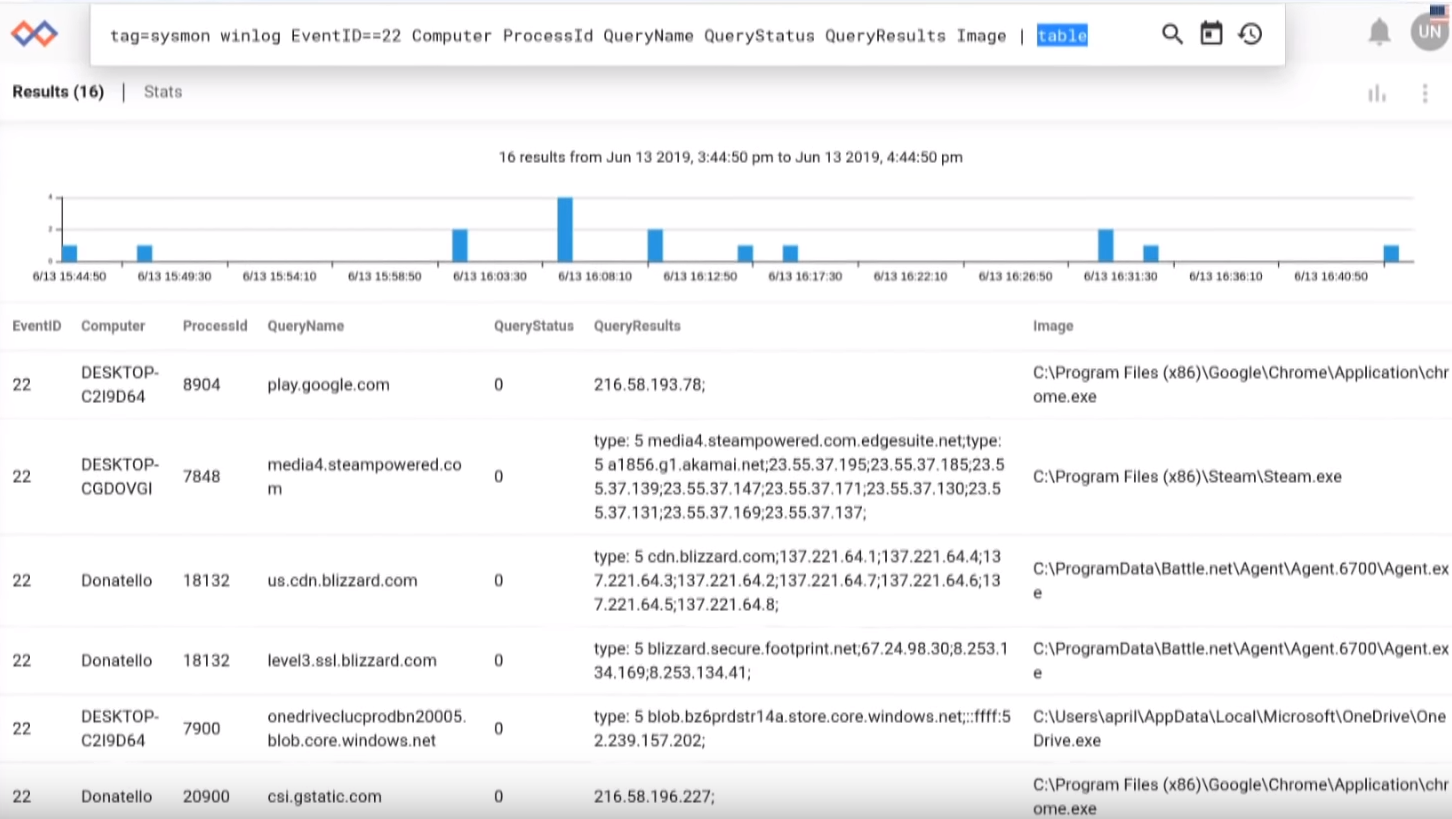
tag=sysmon winlog EventID==22 Computer ProcessId QueryName QueryStatus QueryResults Image | table
From this basic query set we can add some more modules to dynamically manipulate, enrich, and explore as needed. Let's say we were interested in knowing which root domains are most frequently requested. We can accomplish this by adding in a regex module to convert the full domain to a root domain, and then pipe that into a counting module for display.
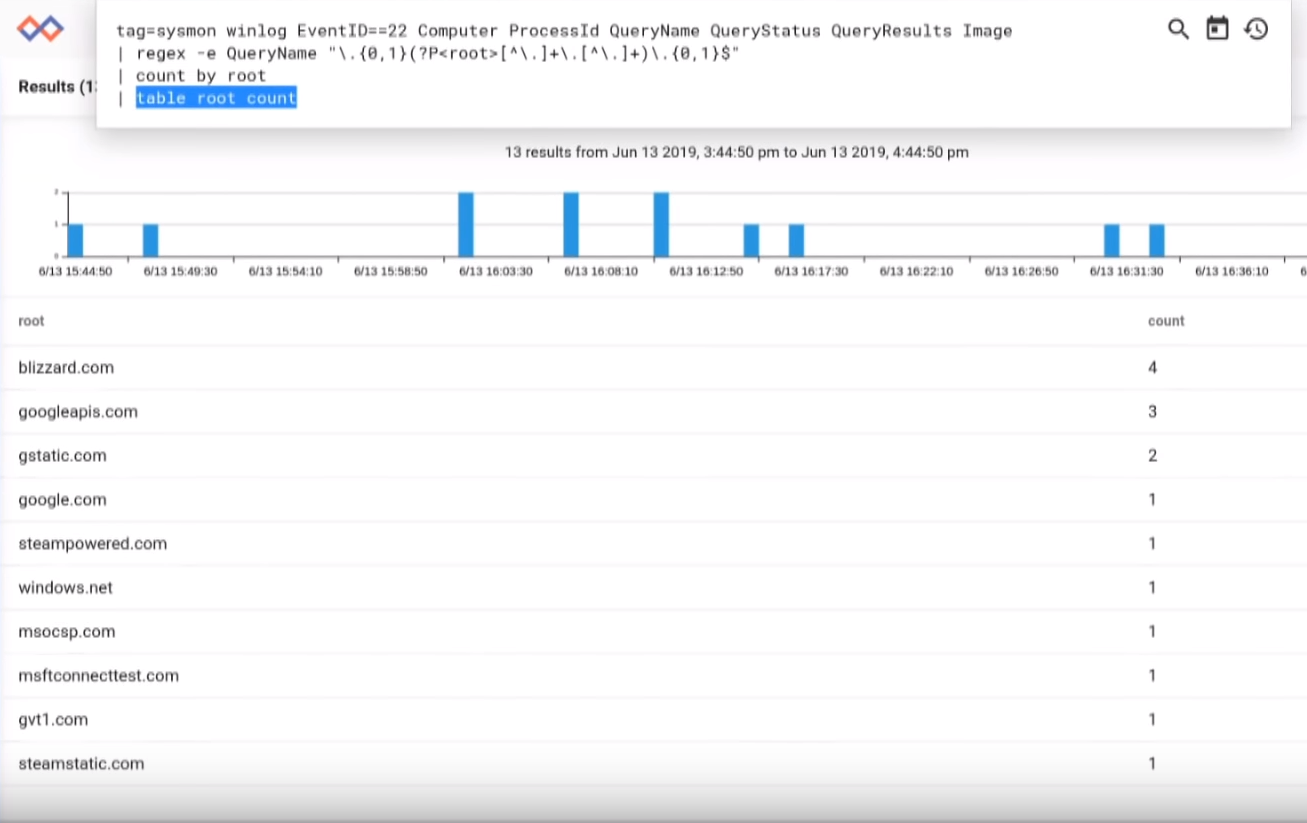
tag=sysmon winlog EventID==22 ProviderName=="Microsoft-Windows-Sysmon" Computer QueryName
| regex -e QueryName "\.{0,1}(?P<root>[^\.]+\.[^\.]+)\.{0,1}$"
| count by root
| table root count
Similarly, we might be interested in a chart of the top level domains that are being requested on our network. By using a different regex to pull out the TLD, we can pipe that into a count and instead of piping into table for the final rendering, let's push it into a chart.
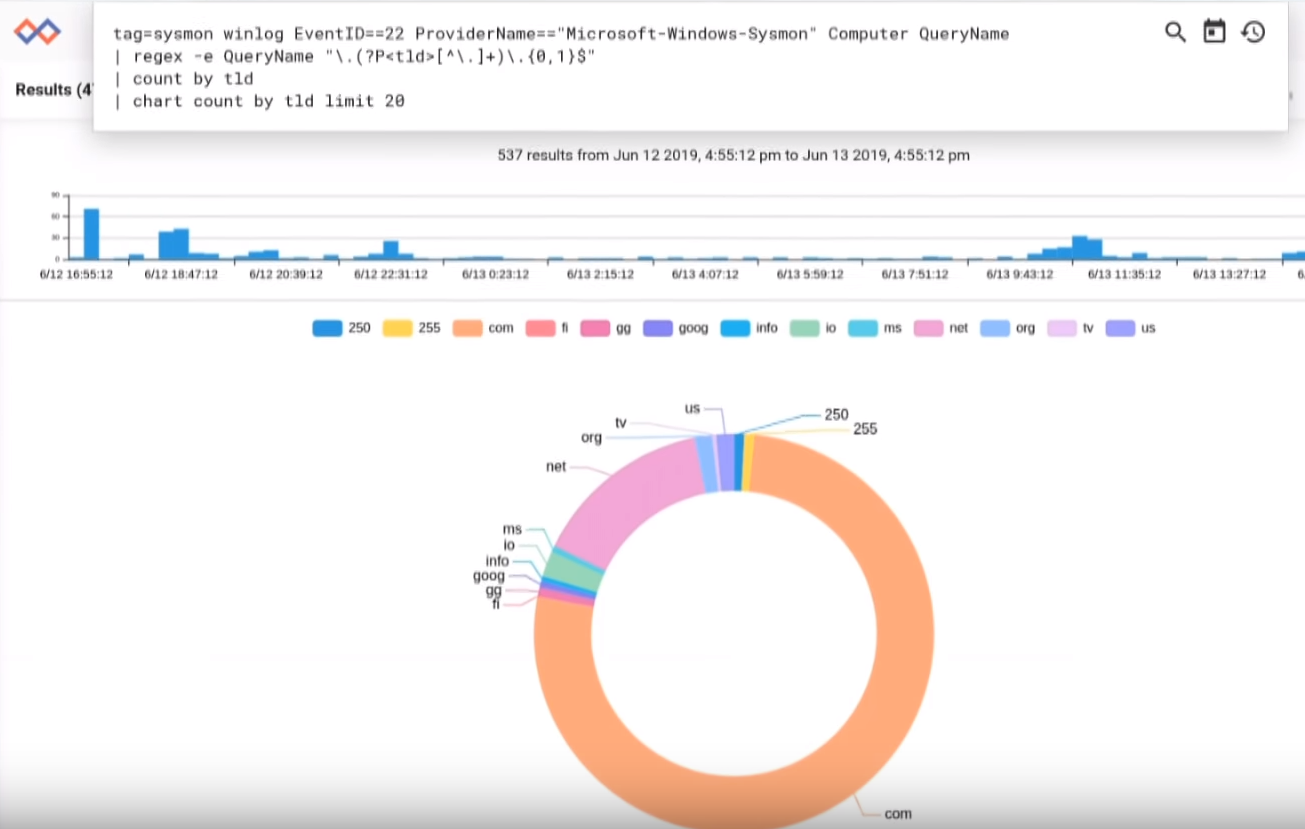
tag=sysmon winlog EventID==22 ProviderName=="Microsoft-Windows-Sysmon" Computer QueryName
| regex -e QueryName "\.(?P<tld>[^\.]+)\.{0,1}$"
| count by tld
| chart count by tld limit 20
By plotting the resolution of DNS on a map, we can observe to which regions of the globe our people are being directed. This might be a great visualization to put up on the wall of a SOC because sudden spikes or shifts from the day-to-day are patterns that humans are good at recognizing. We can invoke another regex to extract the first IP from the DNS results field and then utilize the geoip module to perform a lookup against the Maxmind geolocation database.
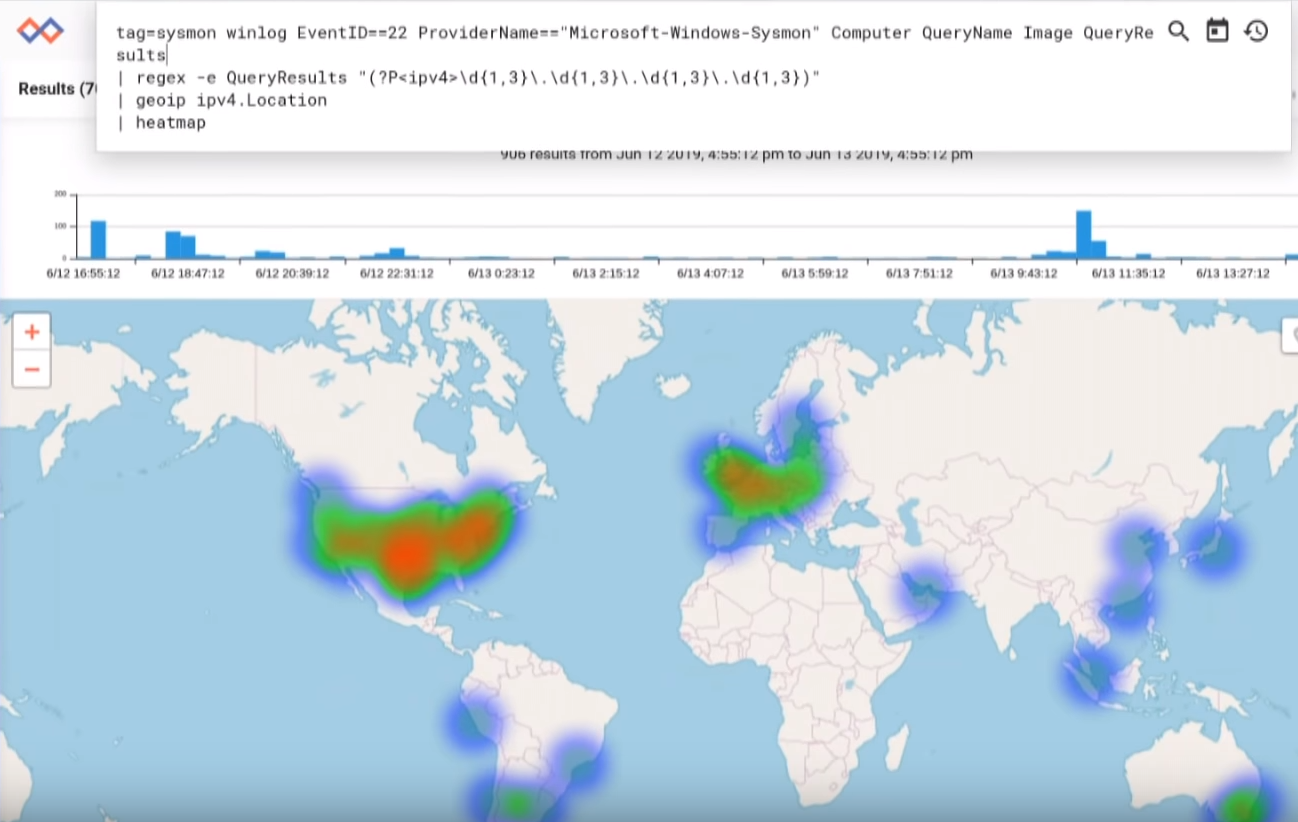
tag=sysmon winlog EventID==22 ProviderName=="Microsoft-Windows-Sysmon" Computer QueryName Image QueryResults
| regex -e QueryResults "(?P<ipv4>\d{1,3}\.\d{1,3}\.\d{1,3}\.\d{1,3})"
| geoip ipv4.Location
| heatmap
Threat Hunting in DNS data
Because of its importance to all network communications, DNS is a fantastic data source for threat hunting. We can build-in some statistical anomaly detection to create Tips, incorporate threat intelligence feeds, use AI for advanced baselining and classification, or more. Let's start out by utilizing a free threat intelligence feed for DNS: malwaredomains.
We first wrote about utilizing malwaredomains threat lists in a previous blog post (auditing dns with coredns and gravwell). That post has a great automation script for keeping your threat lookups current so we'll skip that part here and dive right into making use of it.

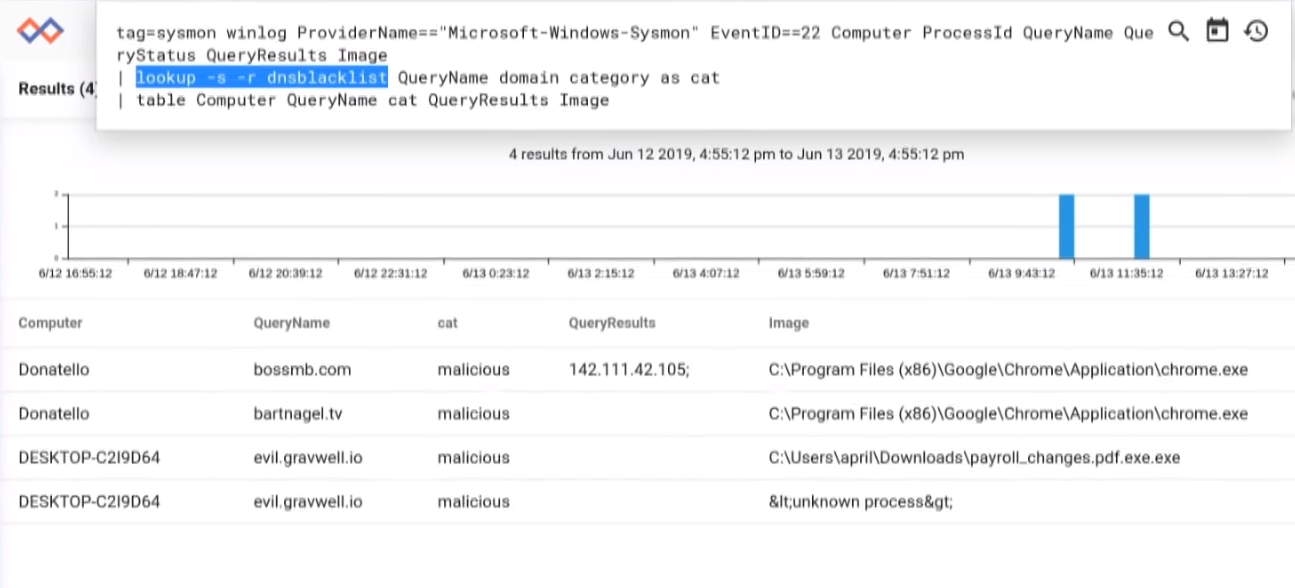
tag=sysmon winlog ProviderName=="Microsoft-Windows-Sysmon" EventID==22 Computer ProcessId QueryName QueryStatus QueryResults Image
| lookup -s -r dnsblacklist QueryName domain category as cat
| table Computer QueryName cat QueryResults Image
We can see a few of the systems on our network reaching out to naughty domains. One of the immediate followup questions to getting a DNS tip is "Did the evil DNS request actually resolve and if so did the suspect computer end up sending any data to this undesired location?" Using Gravwell, we can easily answer that question. We can use the "lookup" module to find requests to known bad domains and then the ip extraction regex to confirm successful resolution.
tag=sysmon winlog ProviderName=="Microsoft-Windows-Sysmon" EventID==22 Computer ProcessId QueryName QueryStatus QueryResults Image
| lookup -s -r dnsblacklist QueryName domain category as cat
| regex -e QueryResults "(?P<queryip>\d{1,3}\.\d{1,3}\.\d{1,3}\.\d{1,3})"
| table Computer QueryName cat queryip Image
This accomplishes the DNS side of answering that question as now we have only resolutions that succeeded, but how do we know whether or not any data was sent? It's time for some DATA FUSION! This is one of the coolest parts to Gravwell but it can be a bit of a mind bender when it comes to drafting up these queries. Let's drop it here and walk through the modules.
tag=netflow,sysmon tag=sysmon winlog ProviderName=="Microsoft-Windows-Sysmon" EventID==22 Computer ProcessId QueryName QueryStatus QueryResults Image
| tag=sysmon lookup -s -r dnsblacklist QueryName domain category as cat
| tag=sysmon regex -e QueryResults "(?P<queryip>\d{1,3}\.\d{1,3}\.\d{1,3}\.\d{1,3})"
First, we have to specify which flows are getting dropped into the pipeline. In this case we want both netflow and sysmon. Then we are going to say that our winlog module should operate on only the sysmon data to extract DNS information. Similarly, we are going to do the DNS threat lookups and the regex extraction only on Sysmon DNS entries.
| tag=netflow netflow IP!~PRIVATE Src Dst Bytes
| tag=netflow ip Src != 192.168.1.99 Dst != 192.168.1.99
Then, we're going to pipe into some netflow analytics modules. By specifying tag=netflow, these modules will extract the fields we are interested in, and then do some basic filtering by IP to remove some systems that we don't care about for this analysis.
| sort by time asc
This is the first module that is going to be operating on both tags at once. Because we don't specify a tag for the module, it will operate on every entry in the pipeline. This sort module is just to make sure that any entries that came out of order are explicitly sorted -- we do this because want the DNS resolution to fall into the correct time with the netflow record (first).
| eval if(TAG=="sysmon"){setPersistentMap('badips', queryip, QueryName)}else{setEnum("flowhost", getPersistentMap('badips', toString(IP)))}
This is the most complicated module in our data fusion pipeline. The eval module is going to use a logical check against the TAG to take two different execution paths. If the tag is Sysmon, we are going to put our suspect IP on the naughty list. If the tag is netflow, we're going to lookup the IP from the naughty list and set the enumerated value of "flowhost" which will follow along with the entry as it moves through the pipeline.
| require flowhost
We use the "require" module to drop any entry that doesn't contain the enumerated value "flowhost". This will get rid of any sysmon (because it never has the "flowhost" enumerated value) or netflow that didn't trip against our naughty list.
| table Src Dst Bytes flowhost
Finally we table it all up for review. It's a complicated query but the results are awesome because we can create contextual awareness that otherwise takes specialized tools. All we had to do was draft up the query and Gravwell took care of finding all of the data, efficiently organizing and multithreading, searching, processing, enriching, etc.
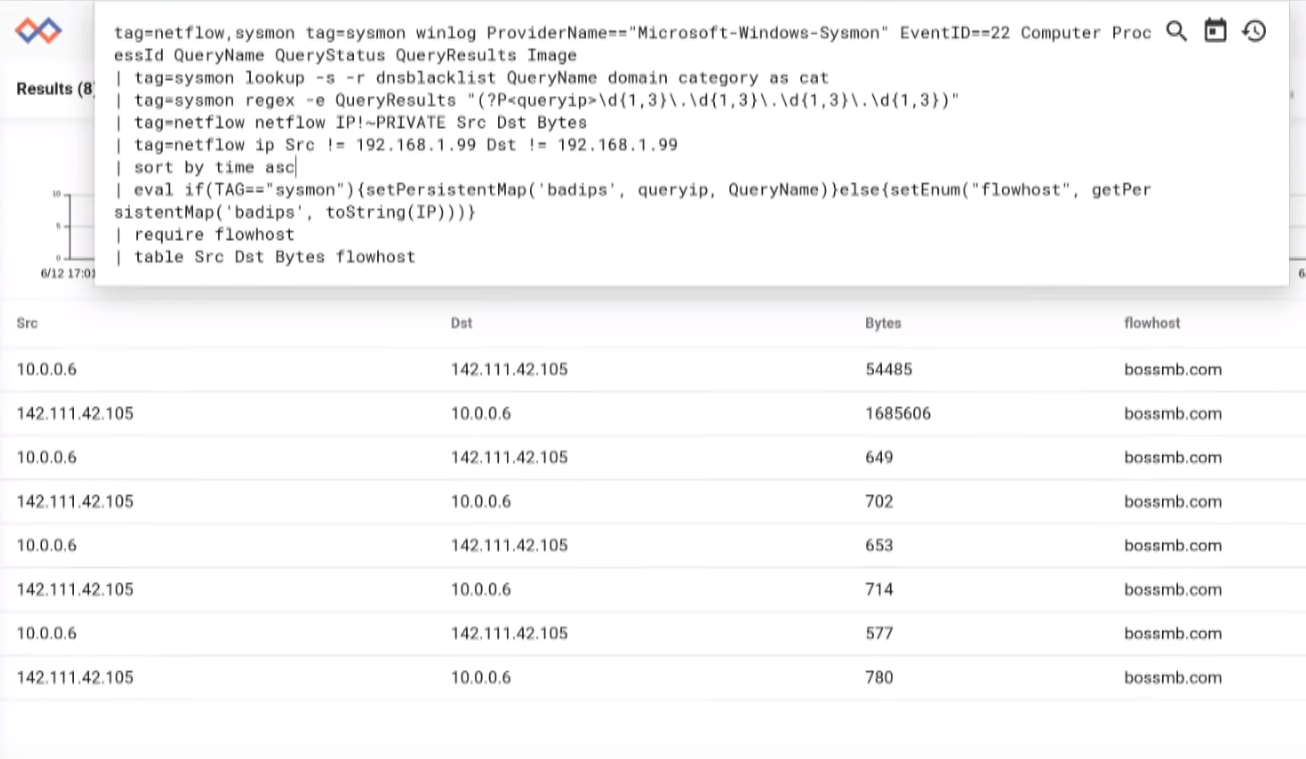
tag=netflow,sysmon tag=sysmon winlog ProviderName=="Microsoft-Windows-Sysmon" EventID==22 Computer ProcessId QueryName QueryStatus QueryResults Image
| tag=sysmon lookup -s -r dnsblacklist QueryName domain category as cat
| tag=sysmon regex -e QueryResults "(?P<queryip>\d{1,3}\.\d{1,3}\.\d{1,3}\.\d{1,3})"
| tag=netflow netflow IP!~PRIVATE Src Dst Bytes
| tag=netflow ip Src != 192.168.1.99 Dst != 192.168.1.99
| sort by time asc
| eval if(TAG=="sysmon"){setPersistentMap('badips', queryip, QueryName)}else{setEnum("flowhost", getPersistentMap('badips', toString(IP)))}
| require flowhost
| table Src Dst Bytes flowhost
When walking through this data on Paul's Security Weekly he asked about adding the network port. All we have to do is modify the netflow extraction module to pull out that value and it will follow the entry as it moves through the pipeline all the way to table. Data fusion makes dynamic exploration of data fun!
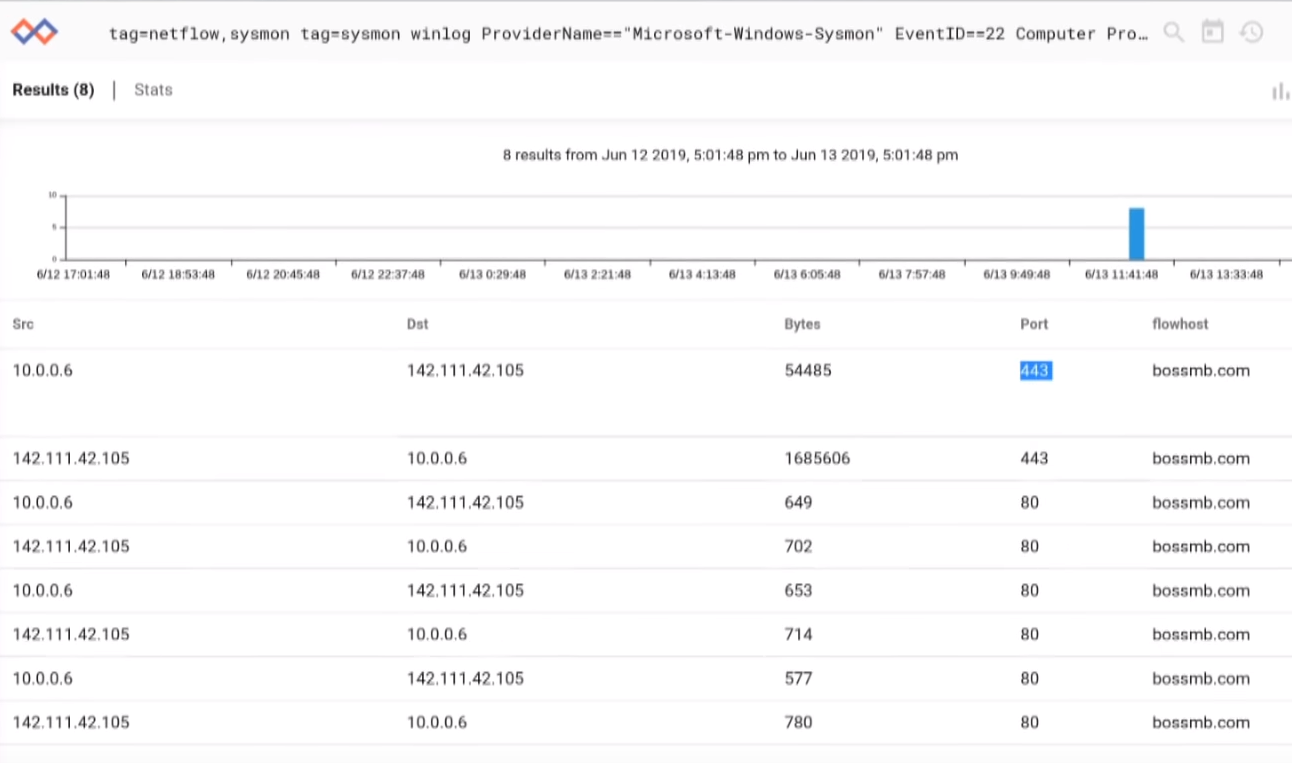
tag=netflow,sysmon tag=sysmon winlog ProviderName=="Microsoft-Windows-Sysmon" EventID==22 Computer ProcessId QueryName QueryStatus QueryResults Image
| tag=sysmon lookup -s -r dnsblacklist QueryName domain category as cat
| tag=sysmon regex -e QueryResults "(?P<queryip>\d{1,3}\.\d{1,3}\.\d{1,3}\.\d{1,3})"
| tag=netflow netflow IP!~PRIVATE Src Dst Bytes Port
| tag=netflow ip Src != 192.168.1.99 Dst != 192.168.1.99
| sort by time asc
| eval if(TAG=="sysmon"){setPersistentMap('badips', queryip, QueryName)}else{setEnum("flowhost", getPersistentMap('badips', toString(IP)))}
| require flowhost
| table Src Dst Bytes Port flowhost
Summary DNS Analytics
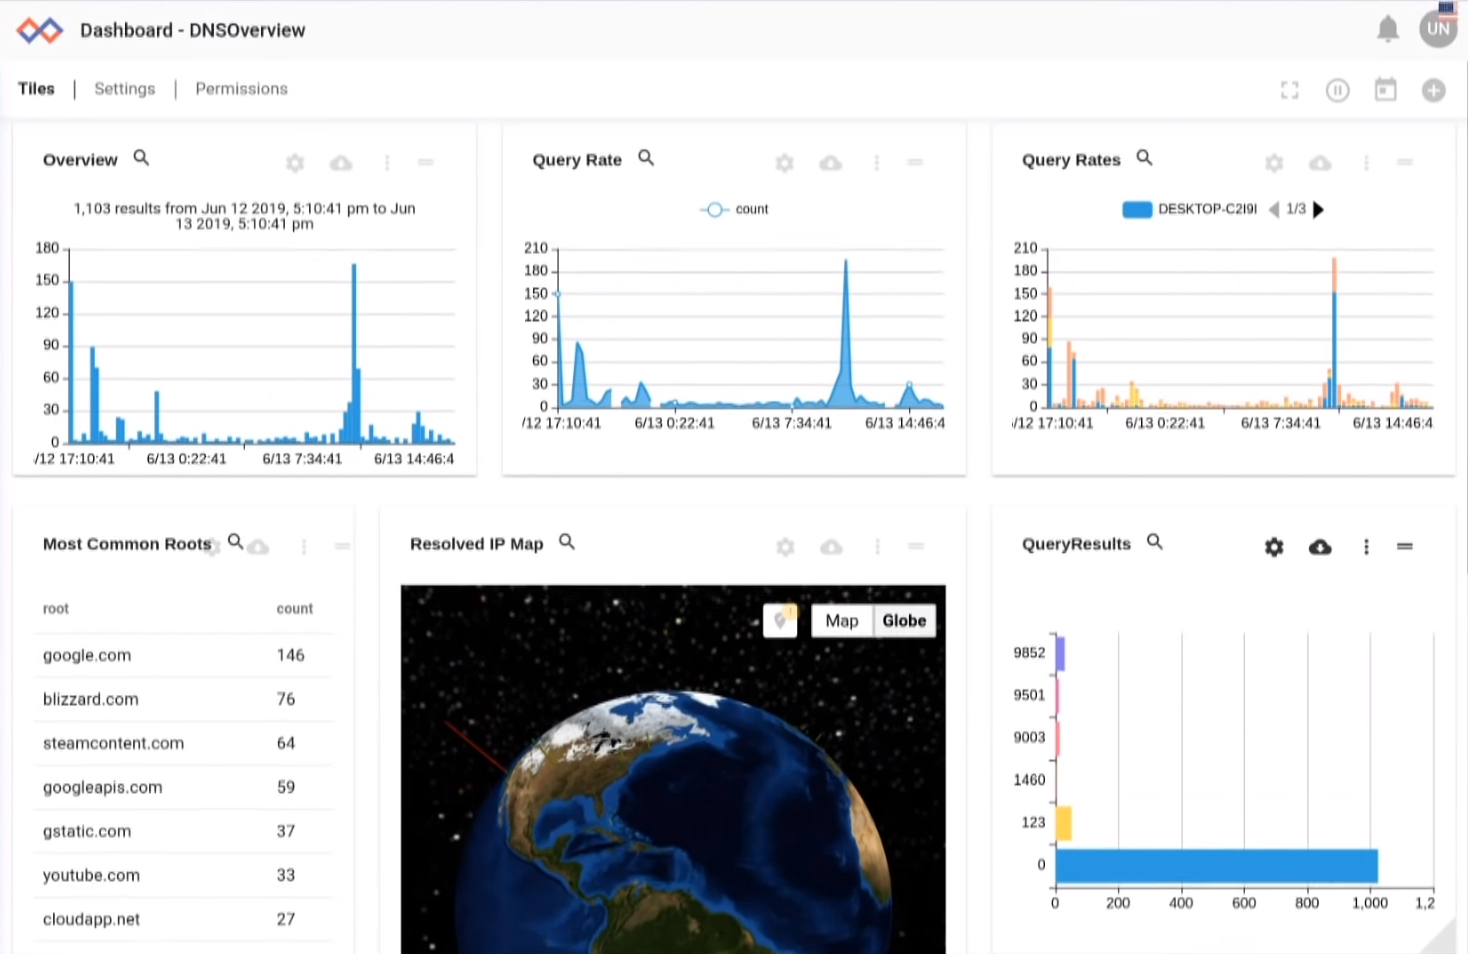
To finish off this walkthrough, let's get some dashboards put together for review and inclusion in reports. The first dashboard is a basic tileset comprised of the searches we have conducted earlier.
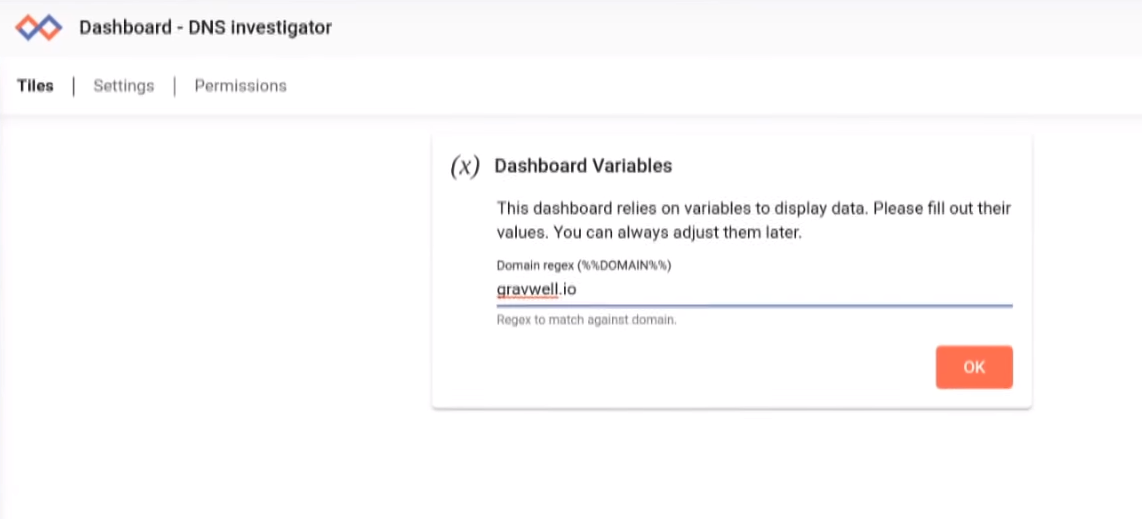
As a sneak preview to upcoming Gravwell release 3.2, here's an example of an investigative dashboard. Investigative dashboards are a new feature that allows you to create a pre-set interrogation based on a given key or keys. In this case, I created a dashboard that asks for a domain name and shows a frequency chart of all requests containing that domain, a list of all computers and total domain resolution request, and some geoip lookup information about the resolution address. Here I am entering the suspect domain, but with the release of Gravwell kits you'll be able to click around for exploration.
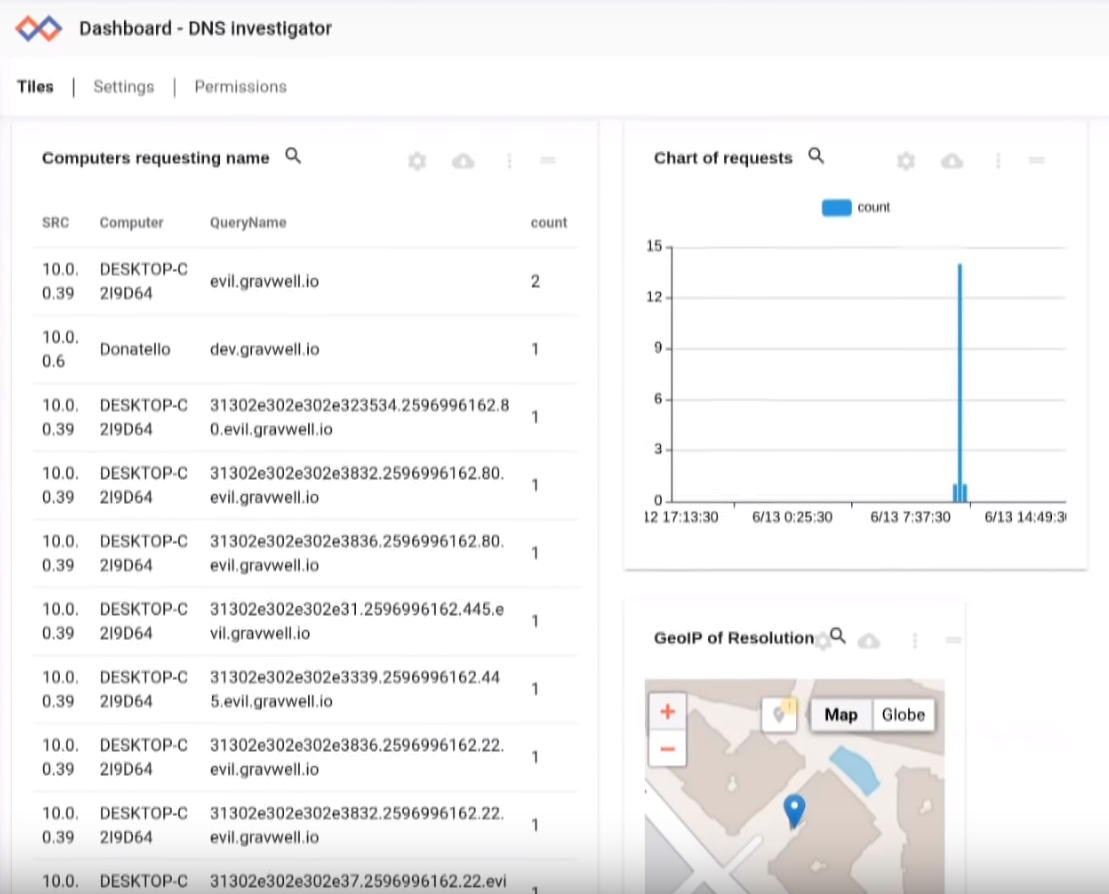
The DNS investigation dashboard shows some suspicious subdomains on the evil.gravwell.io root domain.
To recap:
Windows DNS logging has historically been a bit of a pain. The addition of the Sysmon v10 update makes windows endpoint DNS very accessible and provides a lot of great information. Gravwell is a fantastic tool for analyzing this new data source and using Data Fusion, can create powerful analytics that would otherwise require complicated programming to create.
If you're interested in learning more about how Gravwell and Data Fusion can help your team, request a Free Trial, or hit this button to have one of our Gravwell guides give you an overview of the platform.