Troubleshooting
If log events are not flowing, there are a few things to check before calling support. Additional troubleshooting resources are available on in our documentation. If the WinEvent service flat out fails due to a bad configuration or security critical event, a log message will be sent to the Windows Event log store which can be viewed via Event Viewer.
- Is the GravwellEvents service running?
- Is the appropriate address and port specified in the config file?
- Is the Ingest-Secret value correct?
- Are the indexers or federator reachable (port 4023 and 4024 by default)?
- Are event sources specified appropriately?
- If a TLS transport is used, are indexer certificates trusted?
- Are the clocks on the source machines correct?
- You might be getting the logs, but they have the wrong timestamp.
Configuring the Gravwell WinEvent Service
A very basic WinEvent configuration is shipped and activated by default when the default Gravwell MSI is used to deploy the software. The installer will pop up the configuration file for editing the first time the package is installed. The Gravwell service lives in C:\Program Files\gravwell and the basic configuration (config.cfg) looks like so:
[Global]
Ingest-Secret = IngestSecrets #CHANGE ME!
Connection-Timeout = 0
Verify-Remote-Certificates = true
Cleartext-Backend-target=10.0.0.1:4023
Ingest-Cache-Path="C:\\Program Files\\gravwell\\events.cache"
Log-Level=WARN

[EventChannel "system"]
Tag-Name=windows
Channel=System #pull from the system channel

[EventChannel "application"]
Tag-Name=windows
Channel=Application #pull from the system channel

[EventChannel "security"]
Tag-Name=windows
Channel=Security #pull from the system channel

[EventChannel "setup"]
Tag-Name=windows
Channel=Setup #pull from the system channel
The default configuration is designed to use a cleartext transport to a single Gravwell indexer. It is feeding from the System, Application, Security, and Setup event channels. Each EventChannel specification accepts all event logs in the channel and does not filter based on provider, event ID, or level unless explicitly told to. However, you can establish filters in the EventChannel specifications that will allow for filtering. For example, if we only wanted Error and Warning level events from the System channel that are provided by the BugCheck provider and only Event IDs 1000, 1001, and 1002, the EventChannel definition would look like so:
[EventChannel "system"]
Tag-Name=bugcheckerrors
Channel=System #pull from the system channel
Provider=BugCheck
Level=Error
Level=Warning
EventID=1000
EventID=1001
EventID=1002
EventChannel specifications CAN overlap. This means that you could ingest everything under one tag, and only very specific things under another. When combined with the Gravwell aging system and Well configuration, we can fine tune data retention policies. For example, we might keep all BugCheck and Logon events for a year, but everything else can age out in three months.
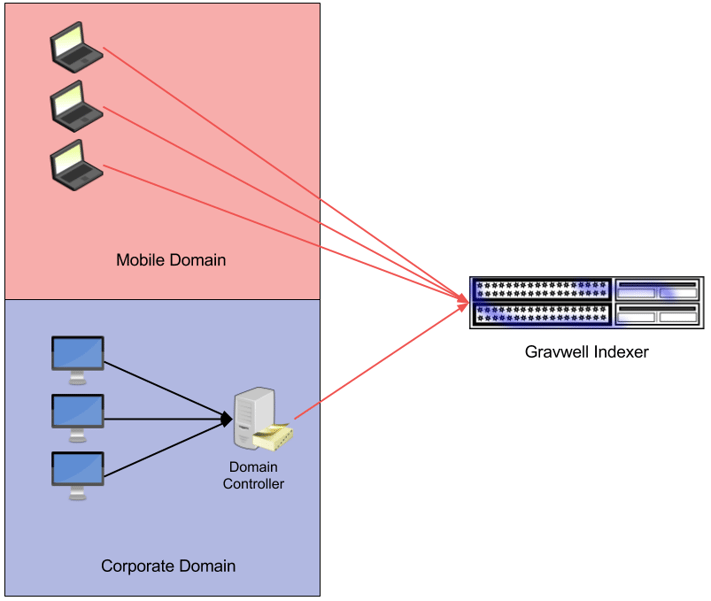
Simple Windows Ingest Architecture
The most simple Windows Ingest architecture is a straight point-to-point system where any number of Windows machines directly talk to a Gravwell instance. Let’s assume there is a small shop of roughly 100 Windows devices resident on a single class B subnet. The small shop has a combination of domain and non-domain devices, some of which leave the network fairly regularly (think laptops). For this configuration, we are going to install the agent directly on the mobile devices, but use the domain controller for Windows Event collection on the desktops so that we can leverage the integrated caching system in the Gravwell ingest framework. The data flows will roughly look like this:
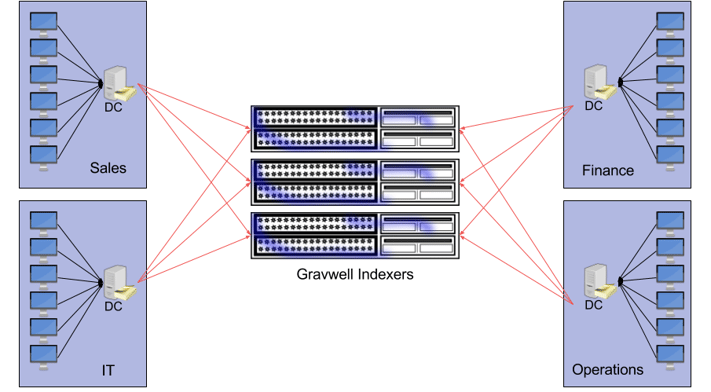
Large Enterprise
Large enterprises with many domain controllers and a high volume of data will most likely deploy multiple Gravwell indexers and potentially many domain controllers. For simplicity, an IT staff may want the domain controllers to aggregate logs from each workstation and then ship the logs from the Domain Controllers to Gravwell.
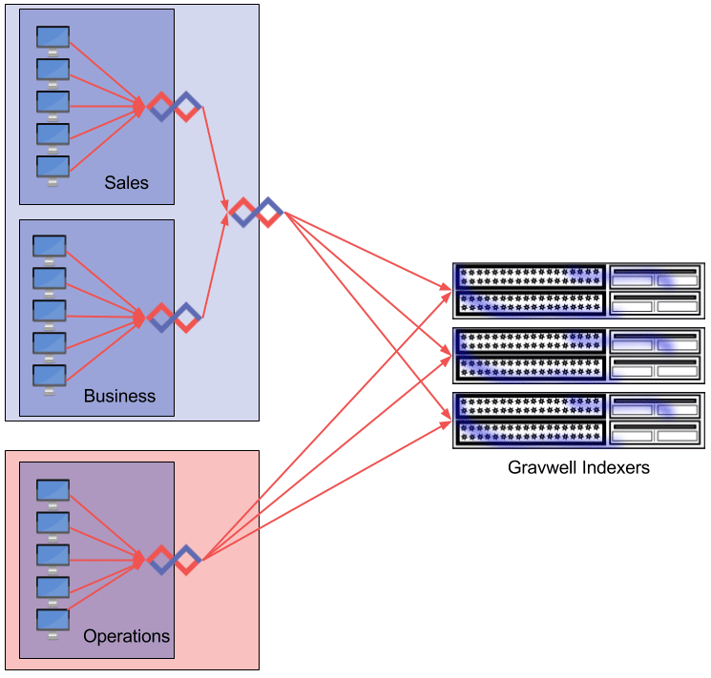
High Security Segmented Network
Gravwell provides a special kind of ingester called the Federator. The Federator acts as an intermediary relay which can isolate network segments and insulate potentially sensitive information (like Ingest Secrets). The Federator also alleviates network strain by aggregating many connections into one and allowing for tiered caching (the Federator ingester is a High Availability ingester, meaning it supports local caching). Federation also helps extremely large organizations avoid congestion and the C10X problem. The Federation ingester also allows for unique authentication tokens and tag restrictions at each aggregation point, so a compromised workstation in the sales department can’t send entries tagged as operational data.
Selecting Windows Events to Capture
The Windows event logging system can be tuned to track a very wide variety of events ranging from account activity, file accesses, application events, and hardware additions, removals, and failures. Not every potentially useful event ID is logged in a default Windows installation, and some require additional daemons. In this section, we are going to highlight a few Event IDs that are particularly useful from a system management and security auditing perspective which do not require additional tools. Microsoft provides a comprehensive list of Event IDs (there are thousands), but the meaty ones that you should REALLY pay attention to are well-documented.
The "It’s Time To Freak Out" Event IDs
Let's start with a few Event IDs that warrant a freak out from a security perspective, mainly because they are weird and/or rare. These should should pretty much never show up in normal day to day operations. I have only seen them once or twice in my entire career; and nearly every time they showed up I was the one doing it or reviewing what another pentester had done.
| Event ID | Description |
| 1102 | The audit log was cleared |
| 1100 | The event logging service has shut down |
| 3001, 3004, 3005 | Kernel mode driver validation failed while attempting to load driver |
| 3002, 3003 | Usermode code integrity checks failed on a protected media path |
| 24658 | The Secure Boot Configuration changed unexpectedly |
Event IDs 1100 and 1102 are pretty self explanatory. If you see these event IDs go by, you should REALLY go check out what was happening immediately prior. This is possible because Gravwell was streaming event logs out of the audit log; you were running Gravwell… right?
I ran into Event ID 3001-3005 when I was trying to load unsigned code into a system I had privileges on. These Event IDs are telling you that the machine attempted to load unsigned code from a location that should ONLY contain signed code. In my case, I had a kernel mode rootkit I was loading that obviously wasn’t signed. I had to reboot the machine and disable code signing to get it in, but the event log still went out. An apt security team should have shown up with sticks, bricks, and stabby things. Unfortunately, they didn’t…
Event ID 24658 signals that something went horribly wrong after a firmware update, or someone is tampering with things they shouldn’t. This error can happen when bootkits are trying to hotswap firmware signatures using races, but any system with a TPM should not get far enough to actually throw this error. We managed to cause this error when playing with a VM while it was booting, for some reason this security team DID feel that repeated reboots and security errors at 2AM warranted investigation...
There are definitely other Event IDs that should kick you into incident response mode; they are always evolving as attackers find ever more clever ways to push themselves into the heart of a system and Microsoft learns how to defend (or at the very least alert about). Some great cheat sheets are available.
Account Security Logs
Account security logs will comprise many of the day to day investigations, which are located in the 4XXX group (Event IDs 4000-4999). The account event IDs represent things like account creation, account deletion, login events, login failures, group policy changes, etc. Here is a list of 10 EventIDs, in no particular order, that every security professional and system administrator should monitor.
| Event ID | Description |
| 4624 | An account was successfully logged on |
| 4777 | The domain controller failed to validate the credentials for an account |
| 4782 | The password hash an account was accessed |
| 4772 | A member was added to a security-enabled universal group |
| 4625 | An account failed to logon |
| 4742 | A computer account was changed |
| 4723 | An attempt was made to change an account's password |
| 4766 | An attempt to add SID History to an account failed |
| 4740 | A user account was locked out |
| 4724 | An attempt was made to reset an account's password |
This is not an exhaustive list, administrators and security staff should keep abreast of what attackers are doing and how Microsoft manages the audit log.
Tweaking The Audit Log
Many of the types of events that we would like to audit are not configured to generate Windows events by default. Depending on the type of environment you are operating in, it can often be useful to watch a lot more than just account activity.
Logon Accounting
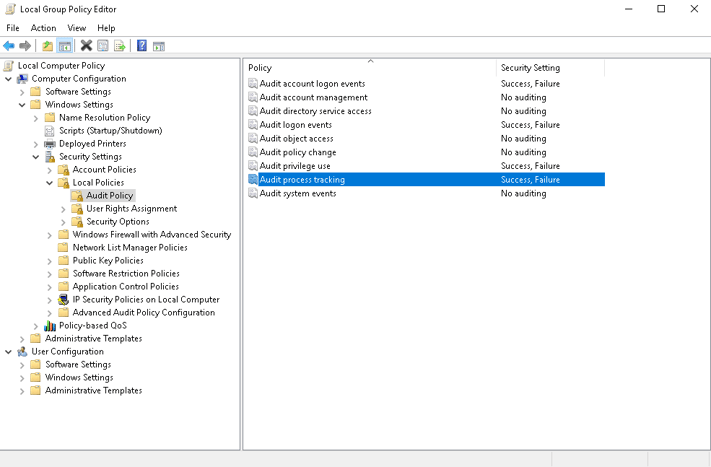
For reasons I may never understand, account logon activity auditing is not enabled by default. If you only make one change to group policy for security purposes (and you should make MANY), it should be enabling account logon auditing. The auditing will produce logs whenever an account logs in, or fails to logon.
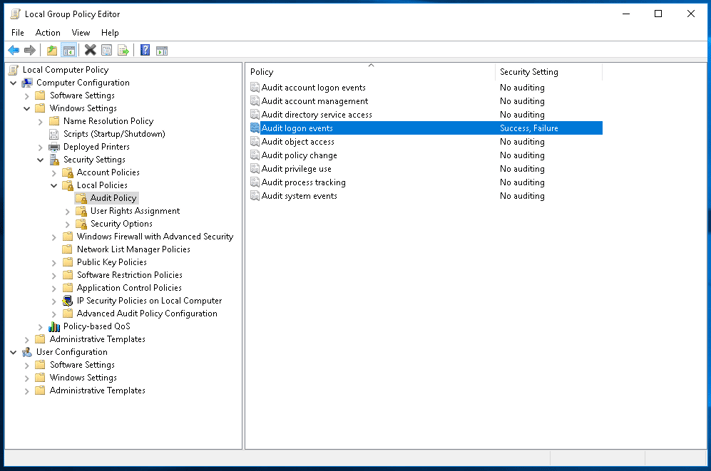
The same audit policy tab can also enable logging account logon events, which is means that an event is generated when an account is validated. The difference between "Audit logon events" and "Audit account logon events" is where the event is generated. "Audit logon events" generates an event on the machine actually hosting the logon/user session, whereas "Audit account logon events" generates the event on the machine doing the validation, like a domain controller. If you have local accounts on machines that may not authenticate against a domain controller enable both.
WARNING!!!!
Notice there are two tabs in Group Policy Editor for auditing: the "Audit Policy" tab and the "Advanced Audit Policy Configuration." It is important to remember that any setting in the "Audity Policy" is overridden by settings in the "Advanced Audit Policy Configuration" settings. If things aren't showing up how you expect, check the "Advanced Audit Policy" section.
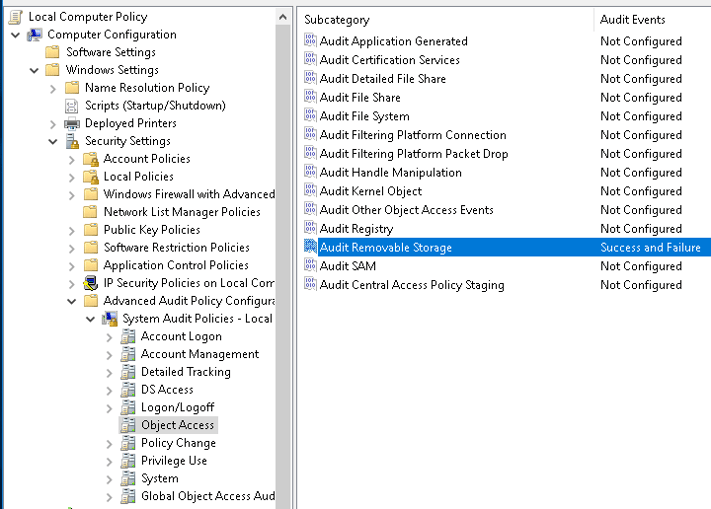
Removable Storage
Removable storage has broken more than a few high security environments; as any security professional knows, users just can't resist plugging in devices they find in the parking lot. Removable storage auditing is not enabled by default, but can easily be via group policy. The exact method of enabling removable storage auditing depends on whether you are pushing group policy via active directory and which version of Windows is being employed. Microsoft provides excellent documentation on this front, but, unfortunately, the ability to audit removable storage wasn't introduced until Windows 8 (and server 2012). For earlier versions of windows, 3rd party software is required. For Windows 10 we are going to enable the both Success and Failure auditing for the "Audit Removable Storage" then sprinkle some USB keys.
Process Accounting
Process auditing allows for kicking off a log event every time a process starts and/or exits. While noisy, the process auditing events can be extremely useful when tracking infections and lateral movement. A good policy is to tag extremely noisy event sources differently than the event sources you may want to keep long term; assign the noisy tags to a seperate Well with more aggressive age out timelines.
Windows Defender
AV choice has almost become as dogmatic as tabs vs. spaces (it's tabs, that is what the key is for you monsters!). It's my personal opinion that Windows Defender isn't a bad option, and my interactions with the Microsoft security teams (albeit limited) indicate they are top notch. So, if your organization has decided to roll with free, getting event logs out of Windows Defender is a great way to centralize reporting an management of AV data. Windows can provide metrics via the Event Log about its health, behavior, and what it finds; we often use the event logs to verify that devices are updating signatures and actually running scans. System administrators don't have to manage a huge swath of different monitoring tools for system health, security data, network data, etc... Just throw it at Gravwell.
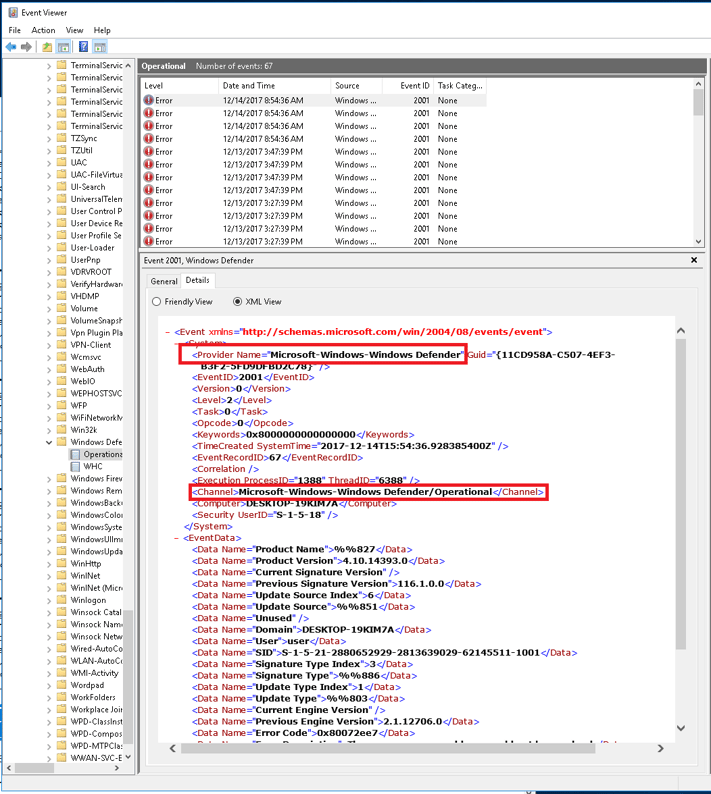
Unfortunately, Microsoft overloads an Event ID for Windows Defender and the Windows Defender source is not enabled by default. Event IDs 1000 and 1001 are used to indicate starts and stops of Windows Defender. Unfortunately, the IDs are also used to indicate many other things as well. Enabling the Windows Defender event logs for Gravwell consumption requires another EventChannel definition in our configuration file. For this blog, we are just throwing everything into a single "windows" tag, but, in a real environment, it may be useful to add additional tags that help segment sources. Add the following and restart the service to start watching Windows Defender:
[EventChannel "windowsdefender"]Tag-Name=windowsChannel="Microsoft-Windows-Windows Defender/Operational"
We are monitoring the Operational channel for Windows Defender, but there is also a WHC channel which provides mostly informational events about the state of the Windows Defender process. An important point on Windows event channels, providers, and the like, is that there are a lot of them and it may not be immediately obvious how a log is generated and what configuration parameters you will need in order to get it. My handy dandy cheat is to just open up Event Viewer, find a log entry I care about, and pull the provider, channel, and source directly from the XML; it's just easier.
Useful Windows Queries
Tracking Login Events
Tracking Logon activity is an extremely common task for system administrators and security staff alike. Sysadmins monitor logins and failures to help debug authentication problems and provide metrics to corporate about user behavior. Security staff use login behavior to identify intrusion attempts, abnormal user activity, and basically monitor authentications.
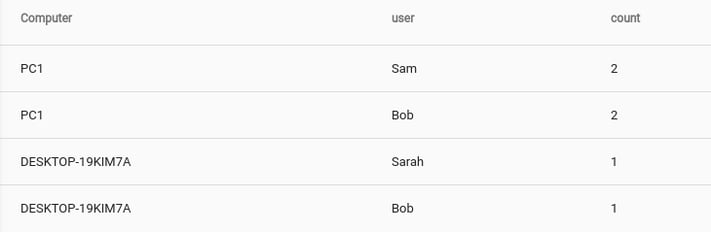
The most basic query for tracking successful logons is to simply count using the username and computer keys, giving a table of the number of times each user logged into each machine in a sorted list. This isn't a query that one would use on a regular basis, but it shows the structure of the log entry and prepares us for dong other more interesting things.
The Event ID we are mainly focused on is 4624, which is used any time ANYTHING gets user session on the machine. We are specifically looking for interactive sessions, so we trim down using grep to look for only the LogonType of 2. Windows being Windows, we have to go one step further and filter based on LogonProcessName because we get a LogonType of 2 when the window manager draws the logon prompt. We only want logon records when the logon processes is "User32" which tells us a user actually logged in.
The Query
The Breakdown
tag=windows
Pull only data that is tagged with the "windows" tag.
grep "<EventID>4624</EventID>"
Grep is fast, like really fast; use it to do the first level of filtering so the xml module isn't processing a ton of data we don't care about. The more you can filter with grep the faster your query will be.
xml
The xml module does the heavy lifting in terms of Windows events and we have several parts. The crux of this module is to extract computer name, username, logon type, and logon process name.
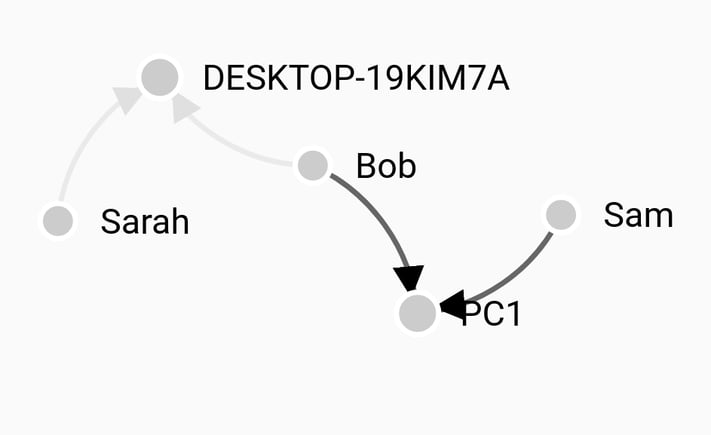
Sometimes, getting a little more than just a list can be useful. If we modify the query to render the usernames and computer names as nodes in a force directed graph, we can visually see user to machine clustering.
Failed Account Logons
Monitoring failed account logins is a great way to identify scanning tools, attempts at lateral movement, and employees misbehaving. Some logon failures are normal; we all fat finger passwords, but there is a threshhold where its time to take a look. Graphing logon failures over time makes it relatively easy to see abnormal activity.
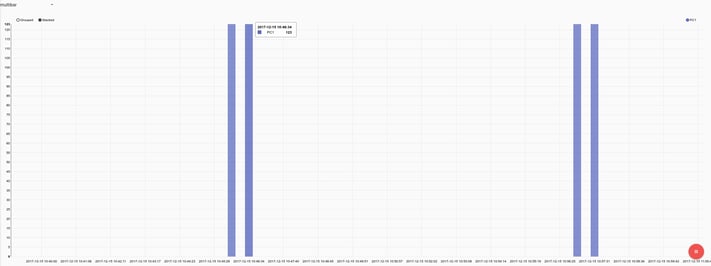
Here we clearly see two big bursts of failed logons against a single machine, which is generally bad.
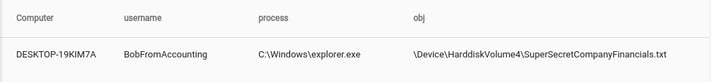
External Storage and "Bob Put What Where"?
Small USB based mass storage devices have completely changed the way data is moved, and completely wrecked more than one very well thought out air gap and or data control policy. Companies and organizations holding sensitive data, whether it be trade secrets or national security information, are painfully aware of how difficult it can be to audit when someone walks out the door with data. Let's take a look at a query that looks any file movement to an external storage device. While long, the query is comprised of fairly simple pieces:
<Event xmlns='http://schemas.microsoft.com/win/2004/08/events/event'><System><Provider Name='Microsoft-Windows-Security-Auditing' Guid='{54849625-5478-4994-A5BA-3E3B0328C30D}'/><EventID>4663</EventID><Version>1</Version><Level>0</Level><Task>12812</Task><Opcode>0</Opcode><Keywords>0x8020000000000000</Keywords><TimeCreated SystemTime='2017-12-13T23:01:26.634739700Z'/><EventRecordID>8831</EventRecordID><Correlation/><Execution ProcessID='4' ThreadID='4188'/><Channel>Security</Channel><Computer>DESKTOP-19KIM7A</Computer><Security/></System><EventData><Data Name='SubjectUserSid'>S-1-5-21-2880652929-2813639029-62145511-1002</Data><Data Name='SubjectUserName'>BobFromAccounting</Data><Data Name='SubjectDomainName'>DESKTOP-19KIM7A</Data><Data Name='SubjectLogonId'>0x18dae1</Data><Data Name='ObjectServer'>Security</Data><Data Name='ObjectType'>File</Data><Data Name='ObjectName'>\Device\HarddiskVolume4\SuperSecretCompanyFinancials.txt</Data><Data Name='HandleId'>0x20a0</Data><Data Name='AccessList'>%%4418 </Data><Data Name='AccessMask'>0x4</Data><Data Name='ProcessId'>0x458</Data><Data Name='ProcessName'>C:\Windows\explorer.exe</Data><Data Name='ResourceAttributes'></Data></EventData></Event>
Query Breakdown
Application Crashes and Failures
Program crashes happen for a variety of reasons, ranging from bad hardware to well... bad software. A devops shop may monitor crashes as a means to discover bugs, misconfigurations, and faults. A system administrator may monitor crashes to better understand service reliability. Security staff monitor crashes to potentially identify attackers crafting exploits against proprietary software or tuning payloads for systems that enable memory randomization. Crashes are generally bad for everyone, and what is an analytics platform if not a system to find "Bad Things?"
The Query
The Output
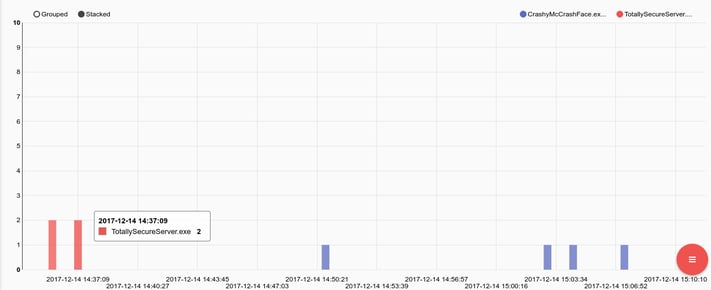
Now, I completely expect CrashyMcCrashFace.exe to crash; it's just what he does. However, to see TotallySecureServer.exe crash 4 times in a short burst on a single machine, well, that just isn't like him. We should probably check that, and pull the network flows to the machine hosting TotallySecureServer.exe to see who was talking to him at the time. If we have full PCAP, we can look for any connections that got RST packets back and zero in on remote addresses that had active connections when the process went down.
Windows Defender Maintenance
Monitoring the Windows Defender logs is a post in and of itself, but to get you started in managing a install base.
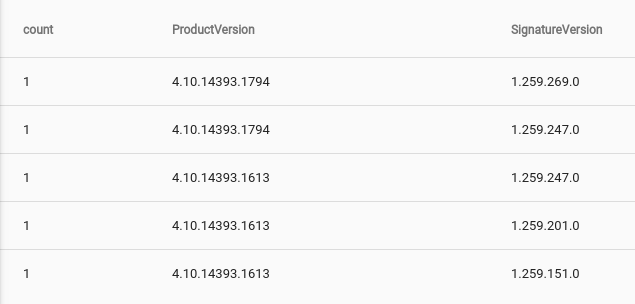
Current Mix of Product and Signature Versions
The query is long due to XML, but the basic gist of it is:
- Fast filter using grep
- Extract and filter the fields we want using xml
- Get a trimmed set using the unique module
- We have to do this because windows will log the same event multiple times
- Get a count of ProductVersion/SignatureVersion pairs with count
Machines Using Old Signatures
Now that we have a listing of Product Versions and Signature Versions, let's go find machines that have old signature sets. The query is almost identical, but we will be adding a negated grep (-v) that only looks for signature versions that do not match the latest. We will also table the Computer so that we know who is out of date.

Sysmon and Taylor Swift (no, seriously…)
The popular Twitter personality (and quite frankly the best Twitter Account in the biz) @swiftonsecurity has released a pretty decent configuration set for the Microsoft sysmon tool. The configuration enables several useful features that typically don’t make it into many enterprises due to the additional load and cost induced on logging aggregation systems; but Gravwell is fast and unlimited, so ingest away.
Some of my favorite additions that sysmon and the @swiftonsecurity configuration provides are:
- Processes starting in non-typical locations
- File time creation activity retroactively changed
- Network connections by services in non-standard locations
- Remote Thread creation by non-standard processes
- Raw disk access and alternate data stream creations
How much of the @swiftonsecurity configuration you want to actually keep is largely determined by the number of machines being monitored and the size of the storage pool available to Gravwell. I recommend leaving it all on and pointing the sysmon data at a Well that ages out relatively quickly, it’s the best of both worlds. There are few things more useful during an investigation than a robust audit of every application start and logs of network connection attempts.
Conclusion
Windows logging is a very different animal and getting Windows to actually give you the information you want can be a tricky process. The event structures also tend to be bloated and contain a lot of information that you either don't care about, or is repetitious. Windows logging can be an expensive prospect (especially if your product is charging you for every byte that hits the store), but, with Gravwell, we try to make it a point to enable you to consume first and ask questions later. Getting Windows to give you the appropriate data is hard enough. Worrying about filtering useless items or customizing formats to trim bytes is counter productive and wastes time; just ingest it, you never know when you might need something.