To celebrate the release of the Gravwell Community Edition we are also releasing a standalone collectd ingester. Collectd is an excellent tool for monitoring the health of hardware, systems, and applications. For this post we will be demonstrating the installation and configuration of collectd to monitor the health and status of a few machines. We will be providing dashboard import codes so that you can quickly and easily import our ready made dashboards. The collectd ingester is part of the core suite of ingesters and is open source on github.
We will also be demonstrating a few scripts which take advantage of our embedded scripting engine to alert an admin about potentially dangerous conditions on a machine (excessive temperatures and/or swap usage). Using collectd and Gravwell we will get excellent insights into the health of our machines and automatically alert the responsible parties should any system exceed an acceptable threshold.
If you are just here for the dashboard import codes, jump to the conclusion.
Installing and Configuring the Collectd Ingester
For the purpose of this blog we are going to assume two Debian based systems with the Gravwell repository registered and keys imported. If this is your first exposure to Gravwell, check out our excellent quickstart guide to started.
- System 1 will host the Gravwell installation and has an ip of 192.168.122.100
- System 2 will host the collectd ingester and has an ip of 192.168.122.106
- The Ingest-Secret is SuperSecretKey
- All collectd entries will be tagged as collectd
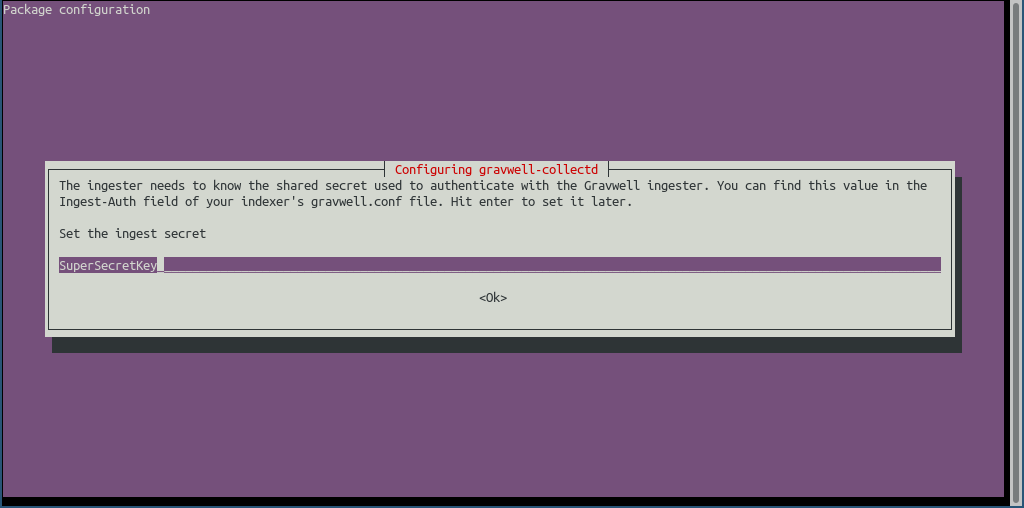
Be sure to input the appropriate IP for the indexer (192.168.122.100 in our case) and the Ingest-Secret (we are using SuperSecretKey). When the installation finishes, if all goes well we should have a new ingester attached to our indexer on our stats -> ingesters page.

The collectd ingester uses a configuration file located at /opt/gravwell/etc/collectd.conf by default. Full documentation for the collectd ingester and its configuration file can be found on the docs page, the configuration generated during our installation looks like so:
[Global] Ingest-Secret = SuperSecretKey Connection-Timeout = 0 Cleartext-Backend-target=192.168.122.100:4023 Log-Level=INFO[Collector "default"] Bind-String=0.0.0.0:25826 Tag-Name=collectd User=user Password=secret
The Gravwell Collectd ingester is acts as a fully stand alone collector. Where others require that you build out an entire collect endpoint and collection framework, Gravwell lets you throw samples directly at a single location and the ingester takes care of everything, including high reliability. Even when infrastructure is dying, the ingester can cache locally and ensure you don't lose data.
Configuring collectd
The full suite of configuration options, plugins, and tweaks available in collectd is beyond the scope of this post, but collectd.org has a great documentation page. For this post we are going to be configuring the cpu, memory, ethstat, df, and swap plugins to monitor the health of the systems and the network plugin to transport data from each collectd instance to our gravwell-collectd ingester. Lets open the collectd.conf file and begin setting up our plugins.
Network Plugin
The first item we are going to configure is the network plugin, un-comment the LoadPlugin network line so that the network plugin is loaded at startup. We are going to configure the plugin to encrypt the transported measurements and use the user/password values user/secret for authentication. If you change the SecurityLevel or Username/Password values away from the defaults be sure to change them in gravwell-collectd ingester configuration file and restart the service.
<Plugin network> # client setup: <Server "192.168.122.106" "25826"> SecurityLevel Encrypt Username "user" Password "secret" Interface "secure" ResolveInterval 14400 </Server> TimeToLive 128 MaxPacketSize 1452 # statistics about the network plugin itself ReportStats false # "garbage collection" CacheFlush 1800</Plugin>CPU Plugin
We are going to configure the cpu plugin to send samples for every CPU core using a percentage value. ensure that the LoadPlugin cpu line is un-commented and add the following to the configuration file:
<Plugin cpu> ReportByCpu true ReportByState true ValuesPercentage true</Plugin>Memory Plugin
Like the CPU plugin we are going to report values in absolute and percentages. If you are only concerned about the relative memory usage for a system, just percentages are fine.
<Plugin memory> ValuesAbsolute true ValuesPercentage true</Plugin>DF Plugin
We are going to configure the DF plugin to monitor specific types of drives and ask for reporting in both absolute and percentages. Percentages are useful for humans to look at while absolute values make it much easier to fire off alerts on absolute values. We are going to instruct the DF plugin to ignore most of the usual virtual devices like tmpfs, proc, cgroups, overlays, and sysfs.
<Plugin df> FSType rootfs FSType sysfs FSType proc FSType devtmpfs FSType devpts FSType tmpfs FSType fusectl FSType cgroup FSType loop FSType overlay IgnoreSelected true ReportByDevice true ValuesAbsolute true ValuesPercentage true</Plugin>Swap Plugin
The swap plugin is extremely easy to configure and outside of enabling the plugin no real configuration is necessary. To be pedantic lets uncomment the swap plugin configuration.
<Plugin swap> ReportByDevice false ReportBytes true</Plugin>Ethstat Plugin
The ethstat plugin is also pretty straight forward, we just need to load the plugin and ensure we have a configuration for the Ethernet device we want to monitor. In our case we will be monitoring the Ethernet device p1p1. If you want to reduce some of the monitored items you can remove them from the mapped values. The interface plugin also serves roughly the same purpose as the ethstats plugin and can sometimes be more generic (e.g. it supports the *BSDs as well as Linux).
<Plugin ethstat> Interface "p1p1" Map "rx_csum_offload_errors" "if_rx_errors" "checksum_offload" Map "multicast" "if_multicast" MappedOnly false</Plugin>Checking the Configuration
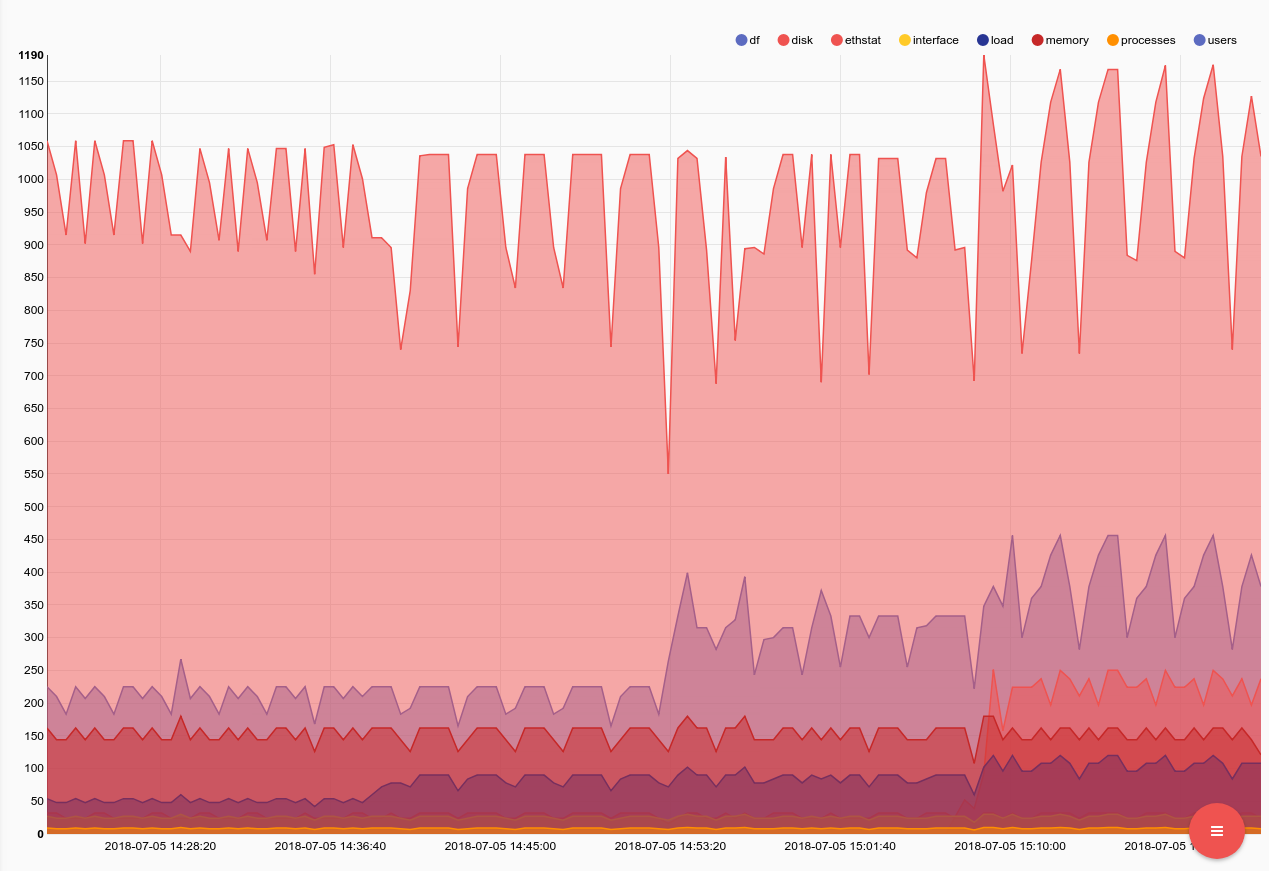
Once the collectd configuration is ready, it's time to restart the service and check that Gravwell is getting the data. We can check the System Stats page to see the number of entries the ingester has received, or we can just take a look at the total number of values for each plugin in Gravwell.
tag=collectd json plugin | count by plugin | table plugin count
Interacting With Collectd Data
The gravwell-collectd ingester ships data as JSON which makes it extremely easy to explore and interact with various plugins, fields, and value types. An example entry emitted from the CPU plugin looks like so:
{"host":"box","plugin":"cpu","plugin_instance":"15","type":"percent","type_instance":"idle","value":98.19639278557115,"dsname":"value","time":"2018-07-05T15:26:42.981740864-06:00","interval":10000000000}
Every entry will contain mostly the same basic fields allowing you to filter for specific plugins and share your searches and dashboards with the community.
Tracking CPU Usage
When running public infrastructure and/or mission critical applications, simple analytics like "how hard are my CPUs working" can be great indicators of future problems. When CPUs are overtaxed, infrastructure struggles and problems compound. We use the collectd metrics to monitor and alert on problems within our own Drafthouse sandbox cluster.
First lets look at a query that simply charts the average CPU percentage across all cores by host using collectd. For this query we are going to introduce a new (as of 2.0.9) feature in the json module which allows inline filtering. We will look at the maximum CPU usage for any core on any given box. This query can help identify aggressive load, even if its only on one core. You will notice that we are using the inline filtering feature in the json module to only look at a specific collectd plugin and type output by adding a "==" to each field.
tag=collectd json host plugin==cpu plugin_instance type==percent type_instance==user value |max value by host | chart max by host
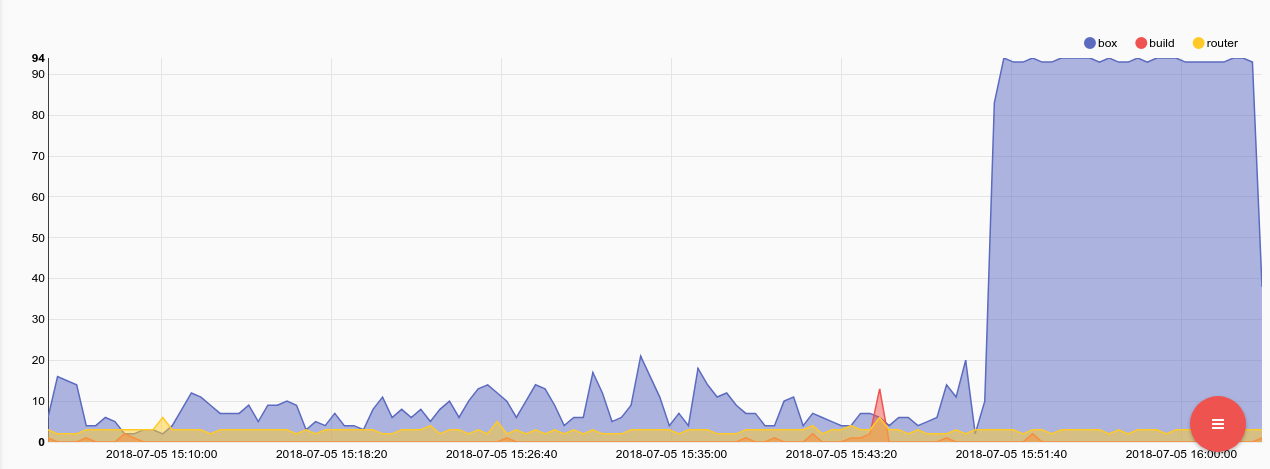
Here we can see that one of the machines named "box" came under extremely heavy load. Lets perform another query, looking just at that machine to see if it was all CPUs or just one thread that woke up and hogged a core. We will add another filter "host==box" to limit the output to only values which came from the host named box. The plugin_instance field represents an approximation of the CPU number which allows us to look at load on each individual logical core.
tag=collectd json host==box plugin==cpu plugin_instance type==percent type_instance==user value | mean value by plugin_instance | chart mean by plugin_instance limit 32
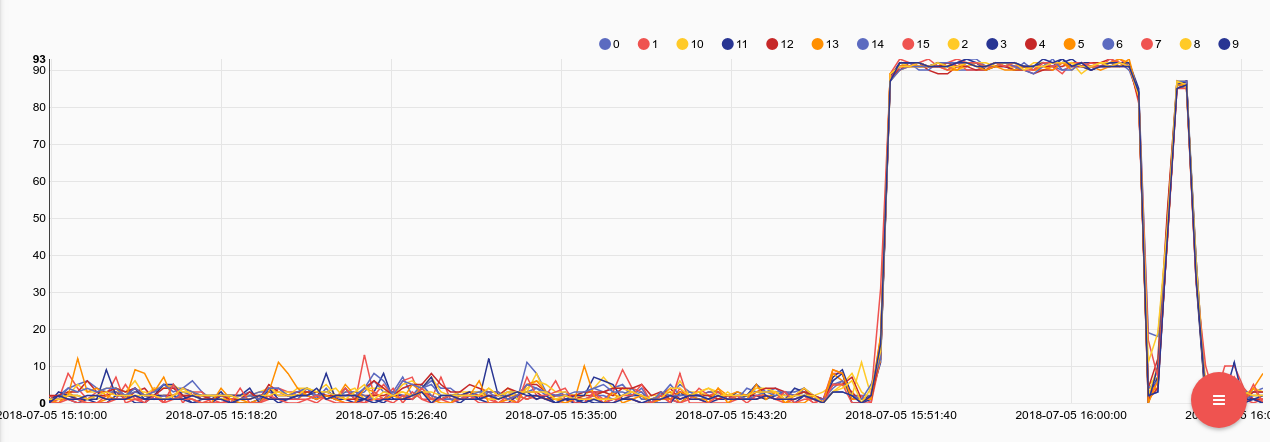
Looks like the machine came under some real load, all 16 threads were almost pinned. Lets do some additional sleuthing to see if there was a corresponding load on memory or swap.
Watching Memory and Swap
Excessive CPU load on a machine can be bad, but when a machine runs out of memory and/or swap the operating system has to start making some hard choices. In the Linux world, that means the kernel fires up the OOM Killer (out of memory killer) which weighs the processes executing on a machine and just starts brutally murdering them until the kernel thinks it is out of danger. That can mean the kernel decides that the offender is your enterprise webserver, compile job, or render task and just kill it. So keeping any eye on memory usage is key to keeping infrastructure up and happy.
tag=collectd json host plugin==memory type==memory type_instance==used value | mean value by host | chart mean by host
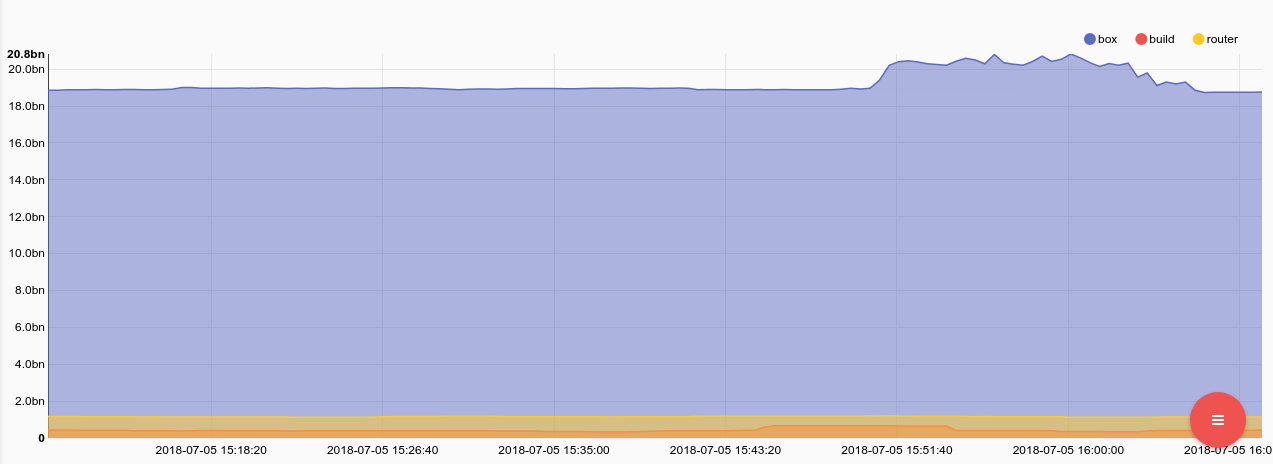
Memory usage went up during the CPU event, but not by much. Lets check swap usage just in case.
tag=collectd json host plugin==swap type type_instance==used value | mean value by host | chart mean by host
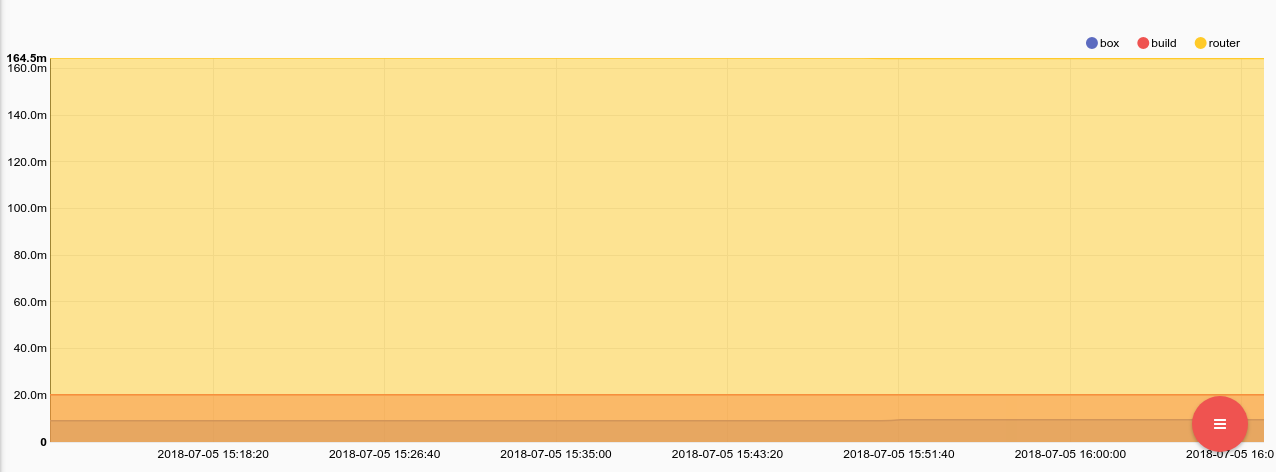
Swap didn't budge for any of the machines, and the host named box is only using about 9MB of swap. This spike in load was almost entirely on the CPU. We checked the syslog audit logs and found that immediately prior to the CPU spike BobFromAccounting logged in. We called Bob and it turns out he felt that the production webserver was a good place to kick off a kernel compile job with make -j32. Completely ignoring why the accounting department felt they needed to build a kernel, we gave Bob a stern talking to.
Just in case Bob tried anything else we threw together a search script which runs every 10 minutes and checks if memory usage on any of our systems exceeds 85%. That way if our memory load creeps up too high, or any of our services start leaking memory we might be able to find them and take action before the OOM gets all stabby on us.
Check this video for an accurate representation of the OOM lying in wait.
Disk Usage Stats
Almost as bad as running out of memory, is running out of disk. When a disk goes completely dry a system can get pretty uppity, especially when the empty disk is the root drive. A query that identifies drives on systems that are low on disk might save you a late night as you attempt to bring a service backup while trying to decide what can stay and what needs to be thrown out the window. This query shows all hosts and drives that are over 80% utilization. Notice that we are filtering out loop devices using the subset operator, any instance which contains the value "loop" is ignored. We are also using the json module perform an inline renaming of the plugin_instance field to the value "mnt."
tag=collectd json host plugin==df type==percent_bytes type_instance==used plugin_instance !~ loop as mnt value | max value by host, mnt | eval max > 80.0 | table host mnt max
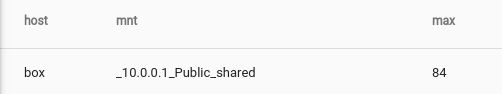
Only one host came up short on disk and it's a remote NFS share, so we won't worry about it.
Because we are so passionate about not running out of storage, we are going to rig up a script which runs every 5 minutes and sends and email if it identifies any hosts with disks that are almost out of space. This script will compile a list of each host mount that is over the the specified threshold and generate an email to be sent. The script also uses the SetPersistentMap system to stash away a time stamp for each each host mount. Using the persistent maps, we can ensure we won't send an email for a specific host/mount more often than once every 3 days. This is an example of using orchestration to automate tasks or sending alerts. We could just as easily post to a webserver, execute commands, or reach out and touch the offending box. Gravwell implements a Turing Complete orchestration engine, allowing you to do almost anything.
var time = import("time")var strings = import("strings")var csv = import("encoding/csv")var bytes = import("bytes")query = `tag=collectd json host plugin==df type==percent_bytes type_instance==used plugin_instance !~ loop as mnt value | max value by host, mnt | eval max > 80.0`end = time.Now()start = end.Add(-10 * time.Minute)server=`smtp.gmail.com`port=587user=`example.user@example.com`pass=`password`#Start our search over the last 24 hourss, err = startSearch(query, start, end)if err != nil { return err}for { f, err = isSearchFinished(s) if err != nil { return err } if f { break } time.Sleep(time.Second)}#get total entriesc, f, err = getAvailableEntryCount(s)if err != nil { return err}ents, err = getEntries(s, 0, c)if err != nil { return err}#let go of the searchdetachSearch(s)printf("entries count: %v / %v / %v\n", c, f, err)body = ``for ent in ents { host, err = getEntryEnum(ent, `host`) if err != nil { return err } mnt, err = getEntryEnum(ent, `mnt`) if err != nil { return err } max, err = getEntryEnum(ent, `max`) if err != nil { return err } #generate a unique key for this host/mount combo hostmount = host + ":" + mnt #pull it from our persistent map stash lastEmail = getPersistentMap(`emails`, hostmount) ts = time.Now().Unix() if lastEmail == nil { lastEmail = 0 } else { lastEmail = int(lastEmail) } #only send every 3 days if ts > (lastEmail + 3*24*60*60) { err = setPersistentMap(`emails`, hostmount, ts) if err != nil { return err } body += host + " mount " + mnt + " is low on storage. " body += max + "% in use" }}if len(emailBody) > 0 { subj = `Disk Usage Alert` to = ["admin@example.com"] from = "Alerts" err = sendMailTLS(server, port, user, pass, from, to, subj, body, false) if err != nil { println("Failed to send email", err) return err } else { println("Sent email successfully") }}
Ethernet Activity And Errors
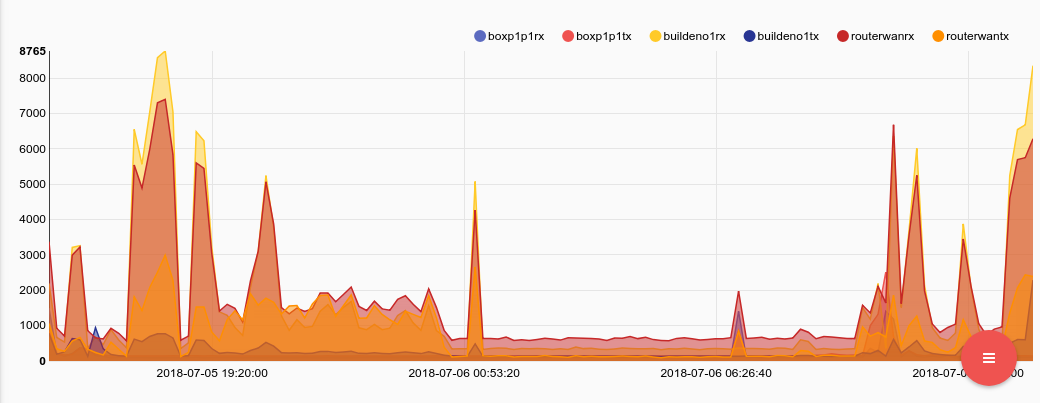
The most basic analytic for ethstat plugin is a simple bandwidth calculator. Using the ethstat data we can watch the total number of packets and/or bytes sent and received on various interfaces over time. Lets take a look at a query that tracks packet flows in and out of each host.
tag=collectd json host value plugin==ethstatplugin_instance as eth type_instance ~ _packets |slice type_instance[:2] | join -t hostdir host type_instance |mean value by hostdir | chart mean by hostdir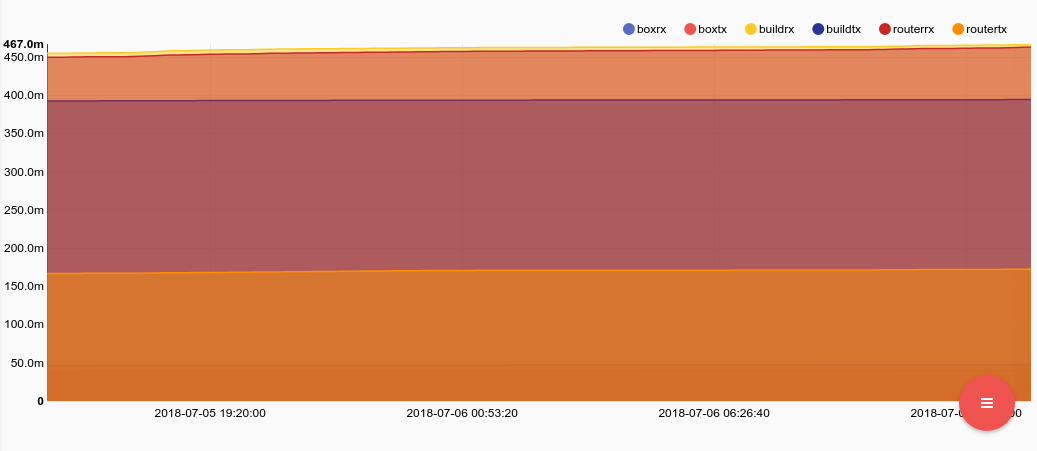
You may be saying to yourself "this graph looks WAAAY too uniform," and you would be right. The problem is that collectd keeps a running tally of values for each host and interface and sends out the updated tally. If we want to see momentary packet rates we will need to do a little math. Luckily Gravwell supports a scripting engine IN PIPELINE as well as a very robust evaluation system, so a little math isn't a big deal. Lets roll a small statement that will execute in the eval module with tracks values and generates a diff between each item. The basic statement will check if a value exists in the persistent map, if it doesn't we put it there, if it does, we calculate the difference and shove the new value back into the persistent map. While the statement may appear complicated, we are basically just tracking the difference between like entries and assigning it to an enumerated value ("dv" in this case). Here is the statement formatted in a more readable way:
if getPersistentMap("vals", hostdir) != nil { setEnum("dv", value - getPersistentMap("vals", hostdir)); setPersistentMap("vals", hostdir, value)} else { setPersistentMap("vals", hostdir, value)}And the search all tied together:
tag=collectd json host value plugin==ethstat plugin_instance as ethtype_instance ~ _packets | slice type_instance[:2] as dir |join -t hostdir host eth dir | sort by time asc |eval if getPersistentMap("vals", hostdir) != nil {setEnum("dv", value - getPersistentMap("vals", hostdir)); setPersistentMap("vals", hostdir, value)} else{setPersistentMap("vals", hostdir, value)} |mean dv by hostdir | chart mean by hostdir
Make note of the additional sort by time asc which ensures that all entries are moving through the eval statement in chronological order. The results are much more inline with what we would expect from packet flows:
If we want to tweak the query slightly and see total traffic (in or out) on all interfaces by all devices we just need to add a sum by host and mean the sum.
tag=collectd json host value plugin==ethstat plugin_instance as ethtype_instance ~ _packets | slice type_instance[:2] as dir |join -t hostdir host eth dir | sort by time asc |eval if getPersistentMap("vals", hostdir) != nil {setEnum("dv", value - getPersistentMap("vals", hostdir)); setPersistentMap("vals", hostdir, value)} else{setPersistentMap("vals", hostdir, value)} |sum dv by host | mean sum by host | chart mean by host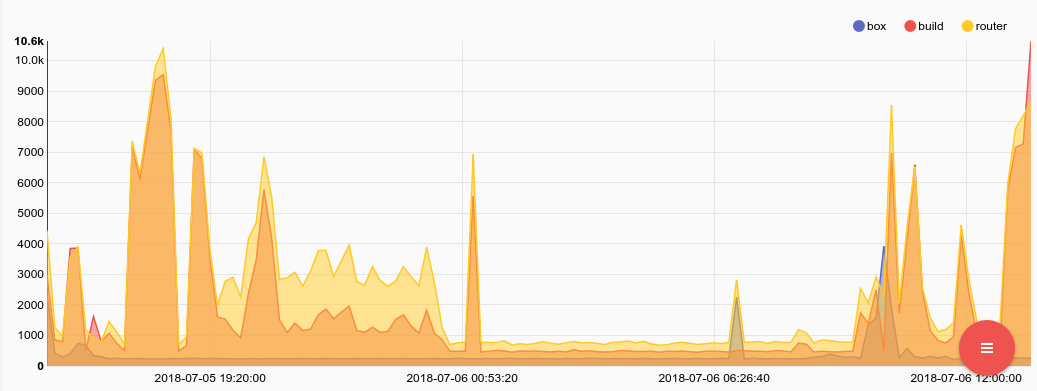
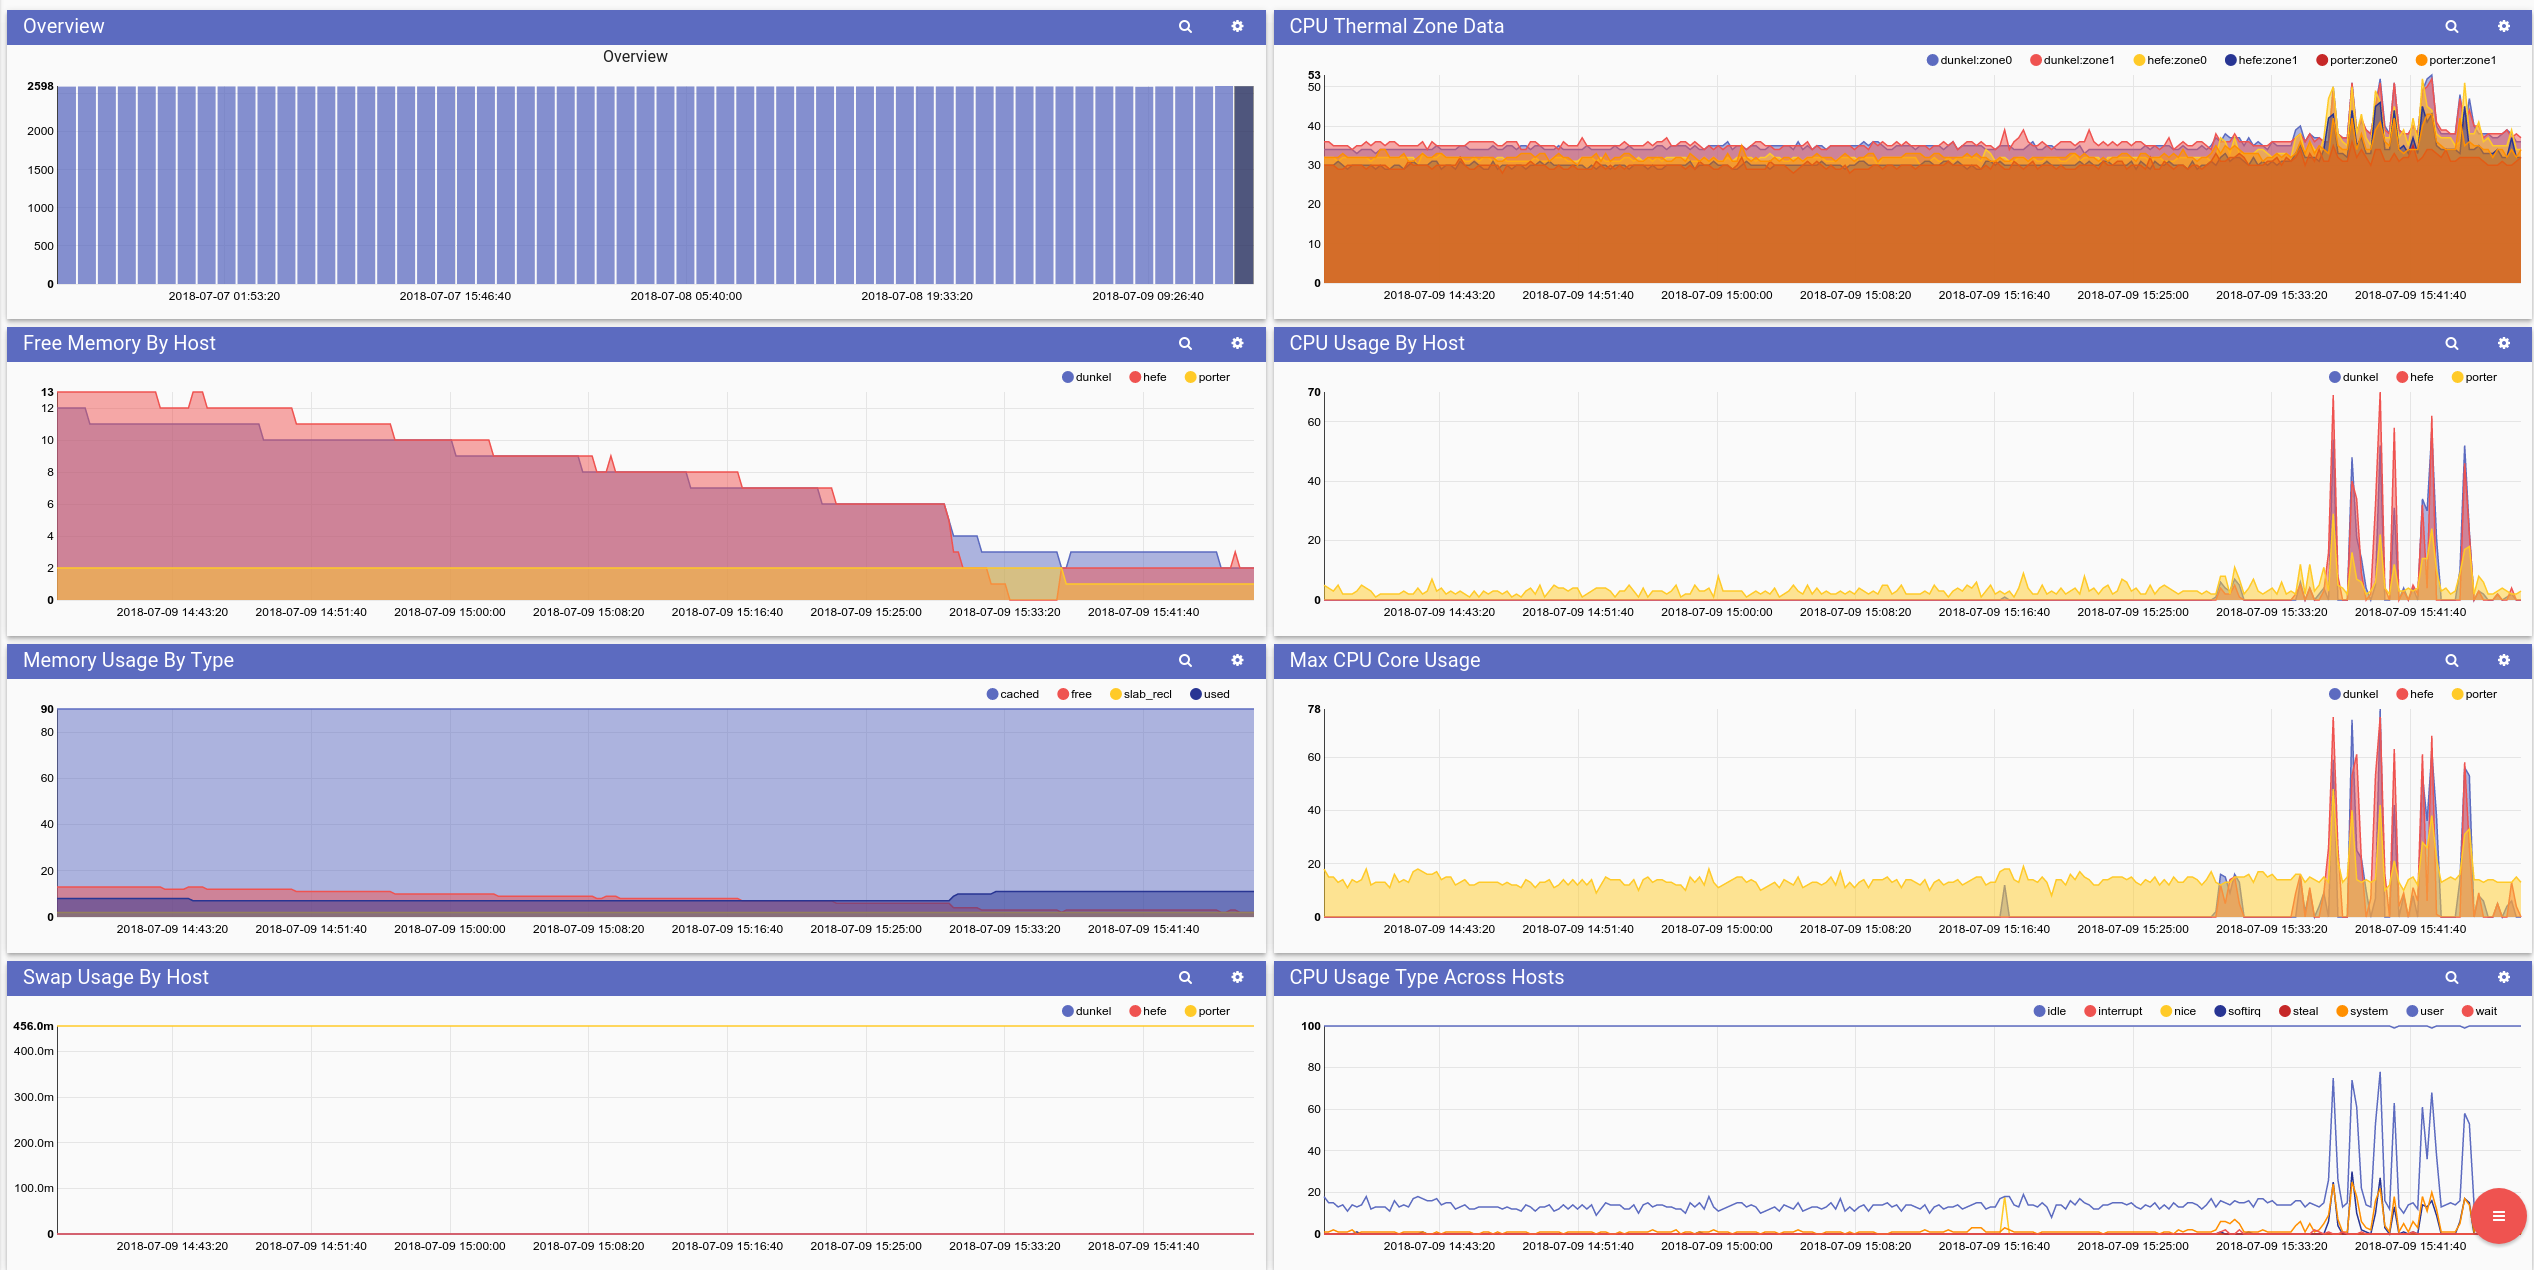
CPU and Memory Usage Across Hosts
This dashboard shows the CPU, memory, and swap usage across hosts. We also show the CPU temperatures for each thermal zone (which in this case are CPU sockets).
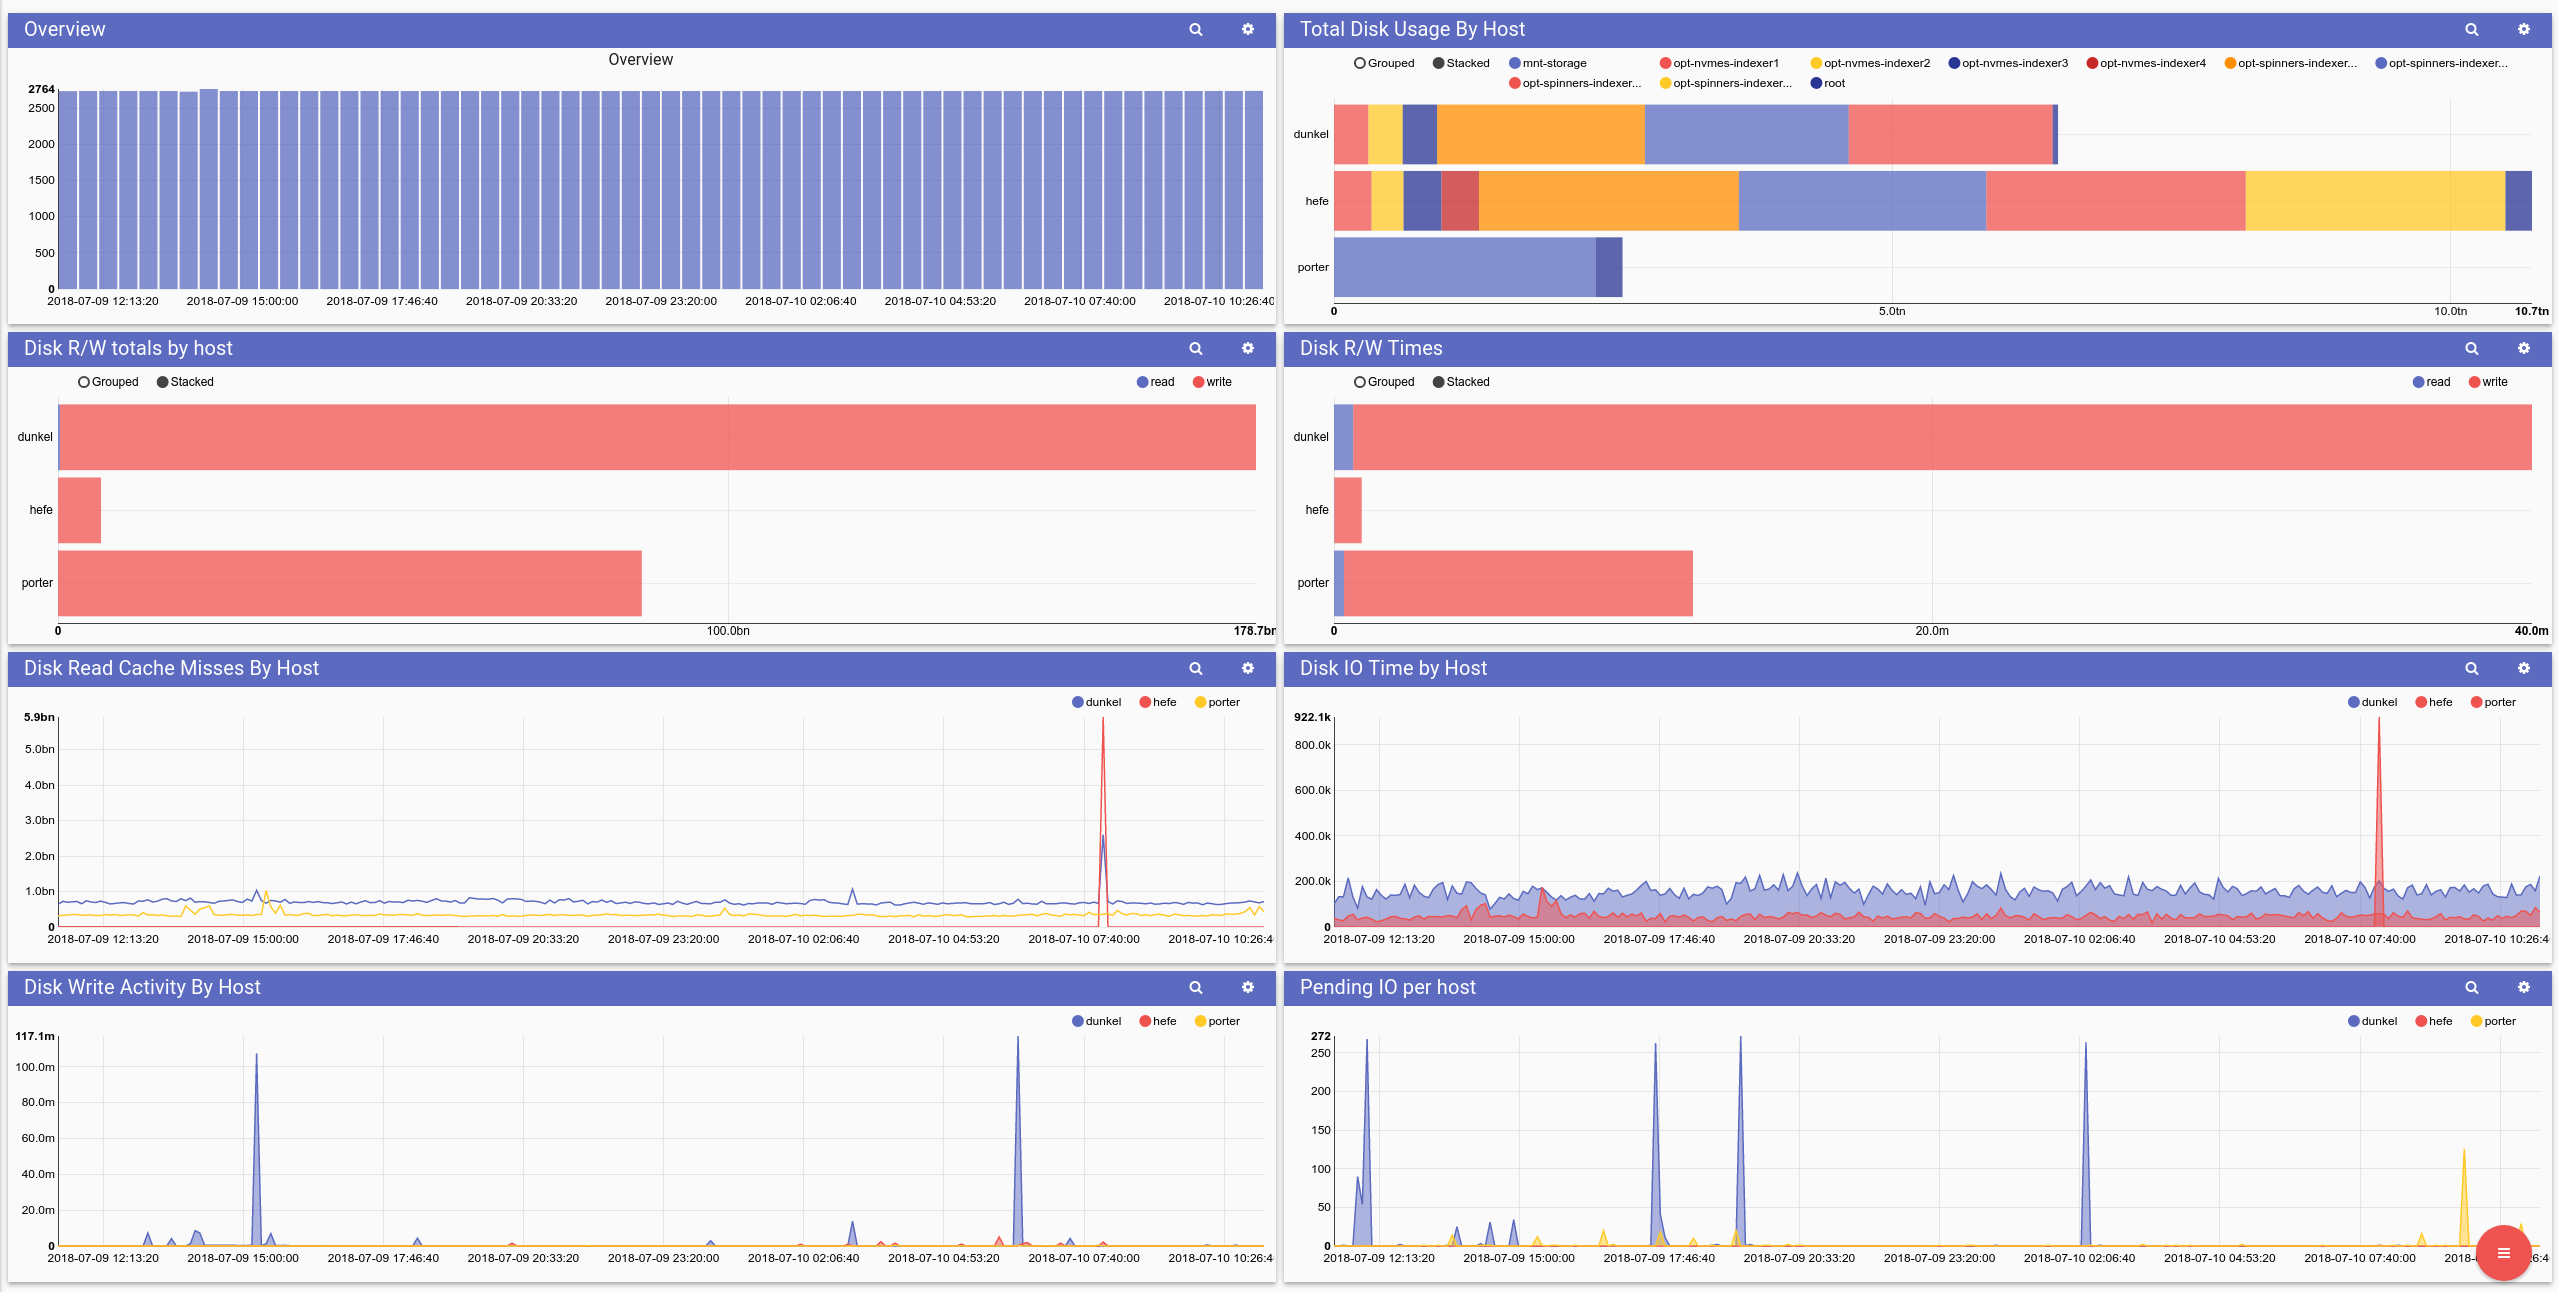
Disk Availability and Usage
Monitoring disk activity can be a great way to identify load imbalances, overloaded disks, or potentially failing disks. In high availability file systems the operating system will mark and attempt to recover bad sectors during operation. The marking and recovering takes a lot more time than a normal disk operation, so unusual spikes in disk IO time can be an early warning to disk failures.
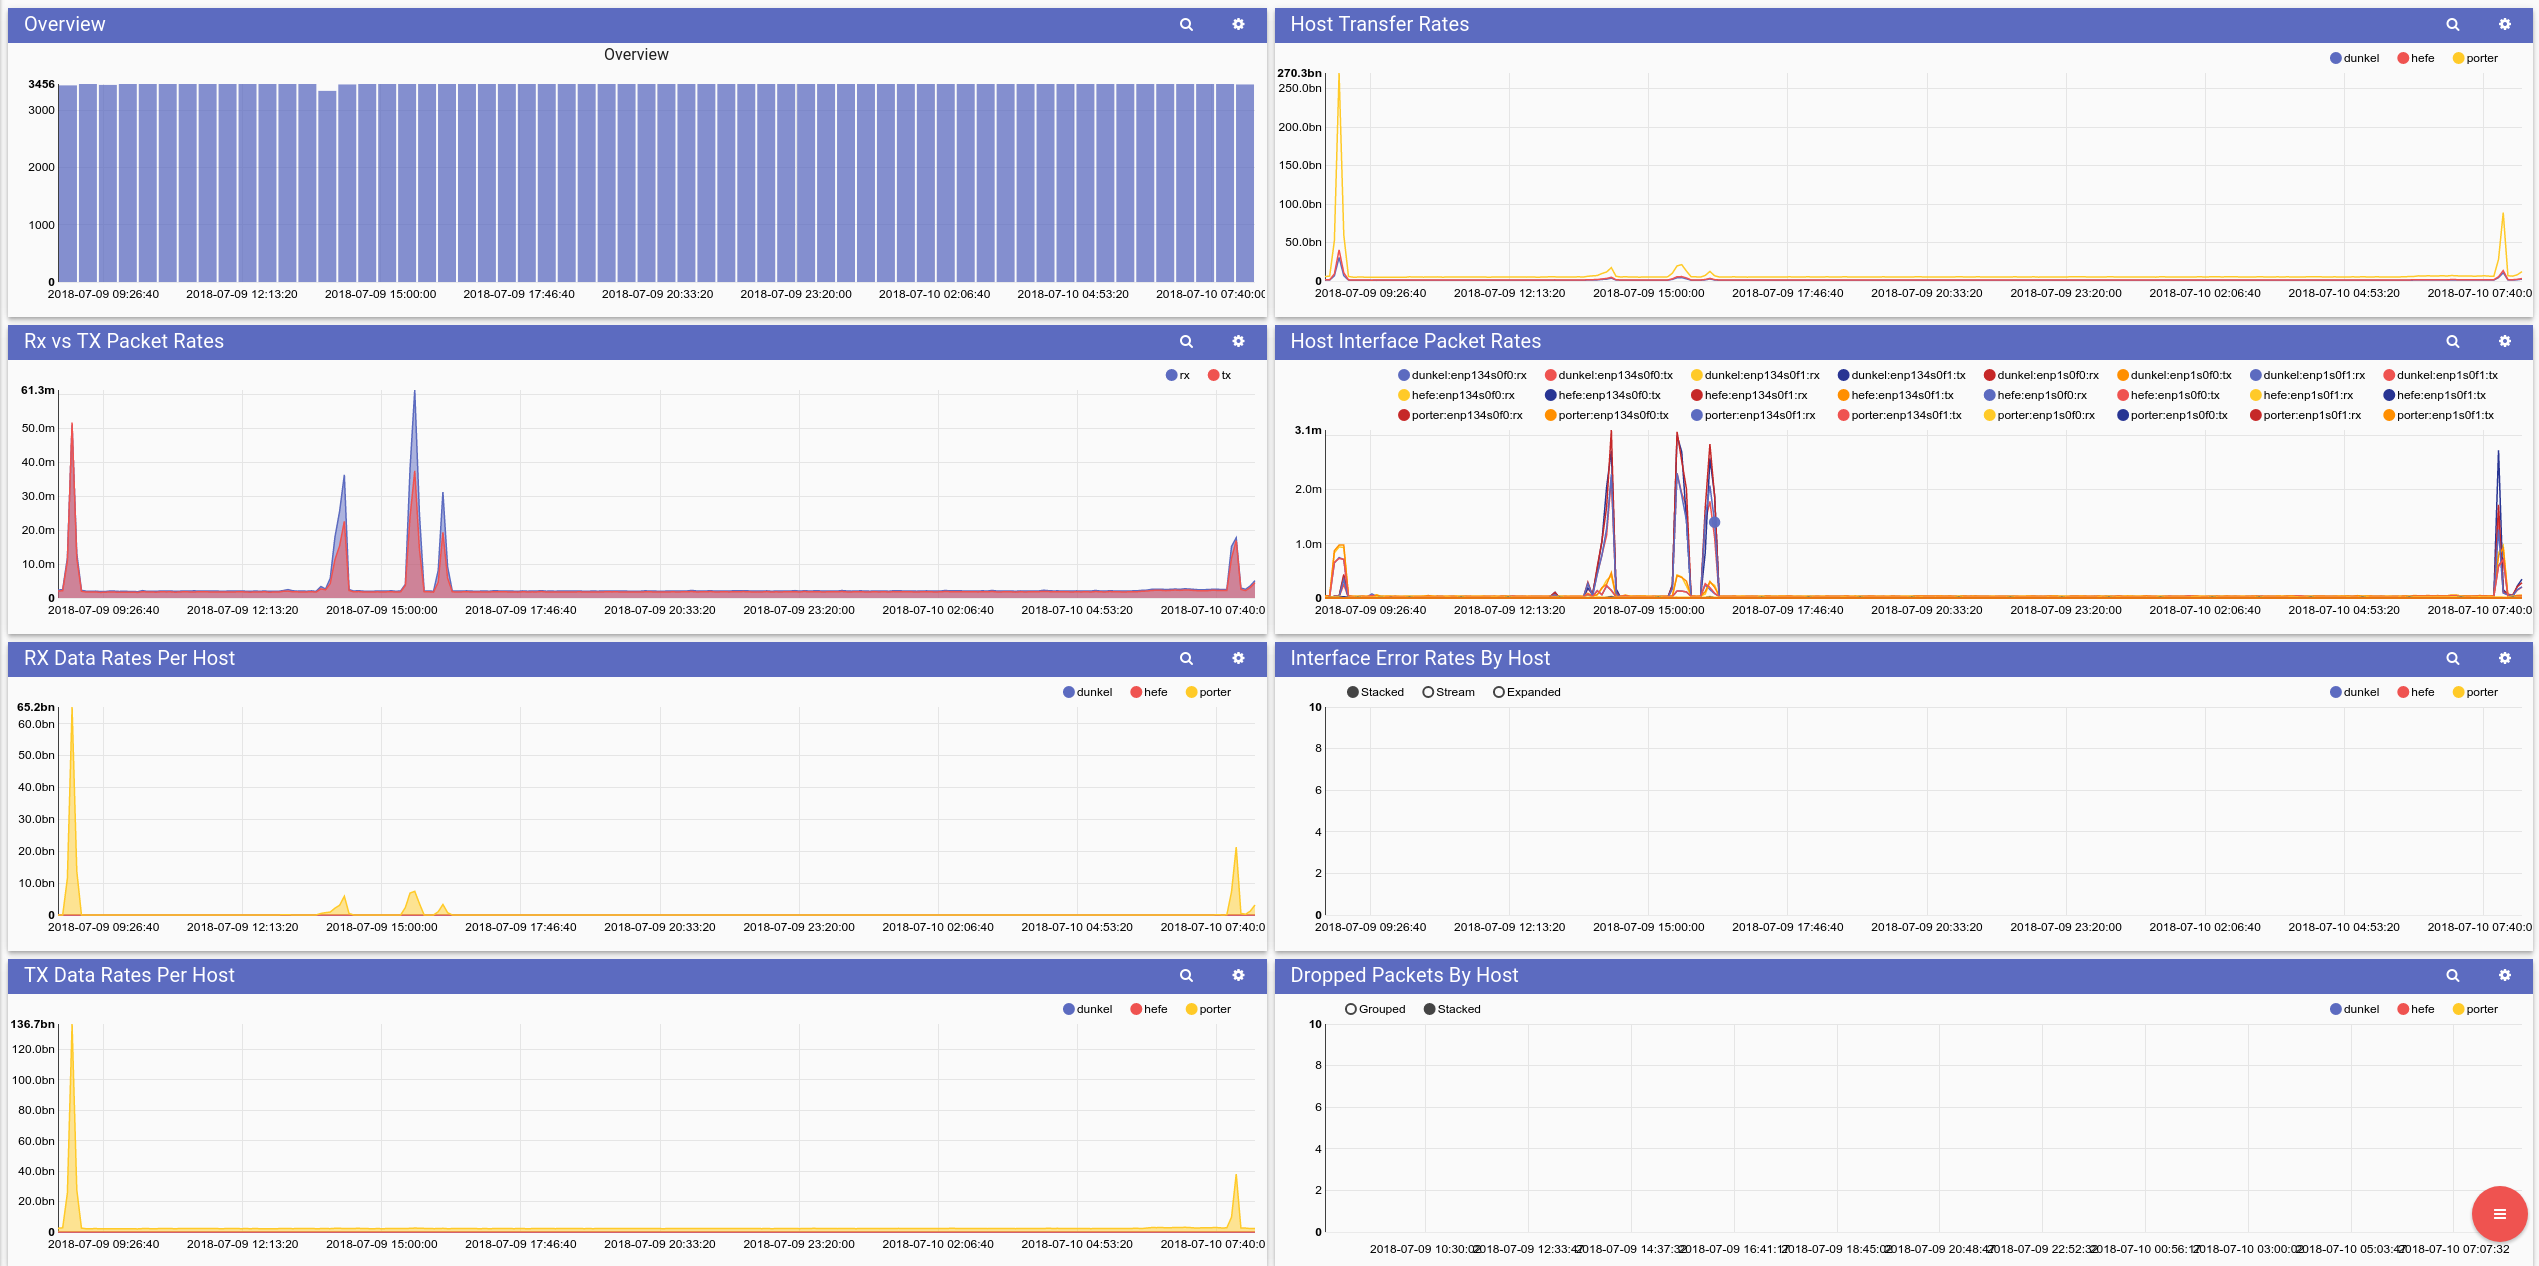
Ethernet Device Usage
This dashboard shows Ethernet metrics around packet rates, total transfer rates, dropped packets, and interface errors. Most of the searches rely on data emitted by the "interface" plugin, which is similar to the ethstats plugin.
Conclusion
We showed how to deploy a Gravwell ingester that acts as entirely standalone collectd collector, then we got a good look at the data and performed some basic analytics. Finally, we built a script that uses Gravwell to monitor some key health indicators and alert us when they fall out of spec.
If you have great queries for other plugins or great analytics dashboards, export them via the interface and post the import codes below. In the not-so-distant future we'll be expanding this import export feature into a more feature-rich way for community members to offer expertise and support to each other.